HOT TOPICS LIST
- MACD
- Fibonacci
- RSI
- Gann
- ADXR
- Stochastics
- Volume
- Triangles
- Futures
- Cycles
- Volatility
- ZIGZAG
- MESA
- Retracement
- Aroon
INDICATORS LIST
LIST OF TOPICS
PRINT THIS ARTICLE
by Koos van der Merwe
We all know that Callaway Golf Co. makes golf clubs, competing with Taylor Made, which is probably the most popular.
Position: Accumulate
Koos van der Merwe
Has been a technical analyst since 1969, and has worked as a futures and options trader with First Financial Futures in Johannesburg, South Africa.
PRINT THIS ARTICLE
DOUBLE BOTTOMS
Callaway Golf Hits For The Green
08/21/12 08:46:25 AMby Koos van der Merwe
We all know that Callaway Golf Co. makes golf clubs, competing with Taylor Made, which is probably the most popular.
Position: Accumulate
| Part of the joy of playing golf is the walk through beautiful fairways and the countryside. Golf courses and clubs attract many in spite of the membership fees, but that is the cost of enjoying the course, not to mention the 19th-hole chat with friends and acquaintances. To make the experience even more pleasurable, golf clubs are made and continually improved to allow a player to enjoy a better score. Callaway Golf is one of the leaders and innovators in this field. |

|
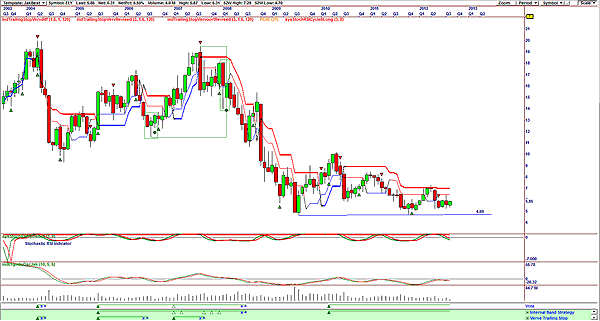
| FIGURE 1: FOUR-WEEK CHART OF CALLOWAY GOLF |
| Graphic provided by: OmniTrader. |
| |
| Figure 1 is a four-week chart and shows that the price has made a double bottom, at $4.69. The price could still be falling as suggested by the stochastic RSI, which has fallen below the zero line. However, the vote line, based on the JM internal band strategy, gave a buy signal in February 2010. |

|
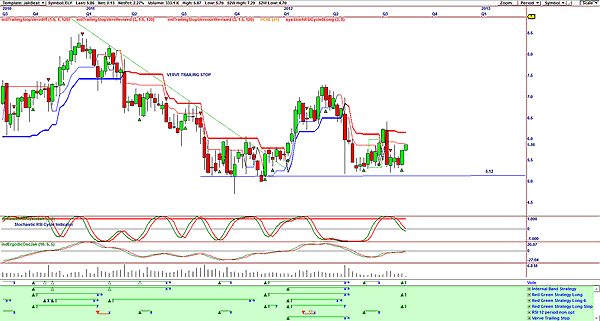
| FIGURE 2: CALLOWAY GOLF, WEEKLY |
| Graphic provided by: OmniTrader. |
| |
| Figure 2, a weekly chart, shows that a major double bottom formed at $5.12. The stochastic RSI cycle indicator is falling, not suggesting a buy, but the vote line has given a buy signal based on the red-green strategy long and the red-green long-stop strategy. The price is still below the Verve trailing stop. |

|
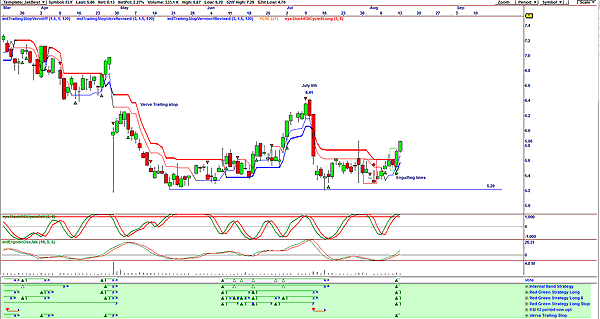
| FIGURE 3: CALLOWAY GOLF, DAILY |
| Graphic provided by: OmniTrader. |
| |
| Figure 3, a daily chart, shows that double bottom at $5.20. The price has risen above the Verve trailing stop. The chart also shows candlestick engulfing lines, a positive indicator as well as a vote line buy based on all the strategies, with the exception of the RSI 12-period strategy. The stochastic RSI cycle indicator is starting to suggest weakness ahead, but the ergodic oscillator is still positive. I would be a buyer of Calloway Golf on any price correction. My target would be the July 9th high of $6.41. |
Has been a technical analyst since 1969, and has worked as a futures and options trader with First Financial Futures in Johannesburg, South Africa.
| Address: | 3256 West 24th Ave |
| Vancouver, BC | |
| Phone # for sales: | 6042634214 |
| E-mail address: | petroosp@gmail.com |
Click here for more information about our publications!
PRINT THIS ARTICLE

Request Information From Our Sponsors
- StockCharts.com, Inc.
- Candle Patterns
- Candlestick Charting Explained
- Intermarket Technical Analysis
- John Murphy on Chart Analysis
- John Murphy's Chart Pattern Recognition
- John Murphy's Market Message
- MurphyExplainsMarketAnalysis-Intermarket Analysis
- MurphyExplainsMarketAnalysis-Visual Analysis
- StockCharts.com
- Technical Analysis of the Financial Markets
- The Visual Investor
- VectorVest, Inc.
- Executive Premier Workshop
- One-Day Options Course
- OptionsPro
- Retirement Income Workshop
- Sure-Fire Trading Systems (VectorVest, Inc.)
- Trading as a Business Workshop
- VectorVest 7 EOD
- VectorVest 7 RealTime/IntraDay
- VectorVest AutoTester
- VectorVest Educational Services
- VectorVest OnLine
- VectorVest Options Analyzer
- VectorVest ProGraphics v6.0
- VectorVest ProTrader 7
- VectorVest RealTime Derby Tool
- VectorVest Simulator
- VectorVest Variator
- VectorVest Watchdog
