HOT TOPICS LIST
- MACD
- Fibonacci
- RSI
- Gann
- ADXR
- Stochastics
- Volume
- Triangles
- Futures
- Cycles
- Volatility
- ZIGZAG
- MESA
- Retracement
- Aroon
INDICATORS LIST
LIST OF TOPICS
PRINT THIS ARTICLE
by Donald W. Pendergast, Jr.
The .OEX dropped only slightly on Monday and may be consolidating prior to another bullish breakout.
Position: N/A
Donald W. Pendergast, Jr.
Donald W. Pendergast is a financial markets consultant who offers specialized services to stock brokers and high net worth individuals who seek a better bottom line for their portfolios.
PRINT THIS ARTICLE
TECHNICAL ANALYSIS
PENDY'S PICKS: August 14, 2012
08/14/12 09:47:39 AMby Donald W. Pendergast, Jr.
The .OEX dropped only slightly on Monday and may be consolidating prior to another bullish breakout.
Position: N/A
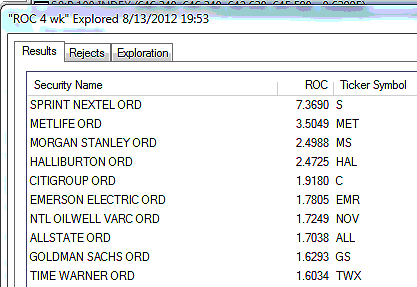
| The .OEX (Standard & Poor's 100) finished Monday's trading session at 645.56, closing down by 0.10%, and with its technical posture still looking as if it wants to run higher once again, despite its early morning selloff. The index is still trading above the May 1, 2012, swing high of 643.29 and may simply be pausing before embarking on yet another swing thrust to higher levels, as hard as that may be to believe. The Dow Jones Industrial Average (DJIA), .SPX, and .OEX have a tendency to run in extended channeling-type trend moves that regularly get the overbought/oversold crowd in a tizzy each time they trend higher and higher, seemingly impervious to bad news or poor earnings reports; this channeling move since early June 2012 might also extend farther than we might normally expect, too. Figure 1 show us the strongest four-week relative strength (RS) performers in the .OEX; we're down to only two energy sector stocks on this list, with Halliburton (HAL) and National Oilwell Varco (NOV) being the two survivors. Sprint Nextel (S) leaped higher once again; traders and investors need to watch this one for signs of an impending correction within the next two weeks. Walgreen's (WAG) is still consolidating, waiting for another trigger to send it higher on a continuation move. MetLife (MET) and Morgan Stanley (MS) continue to strengthen, even as Goldman Sachs (GS) joins the top 10 RS list. |

|
| FIGURE 1: STRONGEST COMPONENTS. The 10 strongest S&P 100 (.OEX) components over the past month, as of Monday, August 13, 2012. |
| Graphic provided by: MetaStock. |
| Graphic provided by: MetaStock Explorer. |
| |
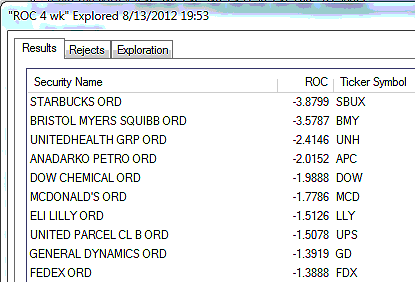
| Figure 2 is a look at the weakest four-week relative strength performers in the .OEX; Starbucks (SBUX) and Bristol Myers Squibb (BMY) are in a neck-and-neck race to determine which stock is the weakest. Eli Lilly (LLY) joins the weak RS stock list, with United Health Group (UNH) still looking right at home here. Anadarko Petroleum (APC) makes its appearance here, too, even as the rest of the energy sector stocks begin to gradually fall out of favor. It appears that financials may want to replace energy stocks as favorites in the ever-changing sector rotation game, so keep that in mind if you are long (or short) stocks from either sector. UPS, FDX, GD, and DJIA also continue to significantly underperform the .OEX. |

|
| FIGURE 2: WEAKEST COMPONENTS. The 10 weakest S&P 100 (.OEX) components over the past month, as of Monday, August 13, 2012. |
| Graphic provided by: MetaStock. |
| Graphic provided by: MetaStock Explorer. |
| |
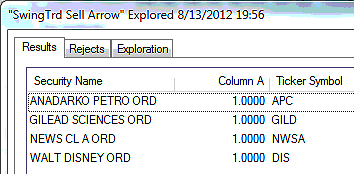
| Figure 3 are the S&P 100 components giving RMO swing sell setup signals; 4% of the .OEX components issued new RMO swing sell signals on Monday. There were also two new swing buy setups in eBay (EBAY) and Starbucks (SBUX). Among the sell setups, note the signal in Anadarko Petroleum (APC); if it drops below 68.42, it will trigger a new short entry, further confirming the rotation out of energies. The remaining three sell setup signals -- GILD, NWSA and DIS -- represent a diverse number of industry groups, and if all three are triggered on declines below their respective Monday lows, then that could be a clue that the .OEX is getting close to its next major swing high prior to a major reversal. |

|
| FIGURE 3: SWING SELL SIGNALS. The S&P 100 (.OEX) components issuing RMO swing sell signals at the close of trading on Monday, August 13, 2012; 4% of all .OEX components fired swing sell setup signals during this session, with two new swing buy setup signals also being issued. |
| Graphic provided by: MetaStock. |
| Graphic provided by: MetaStock Explorer. |
| |
| There were no buy or sell setup signals in any of the exchange traded funds (ETFs) that Pendy's Picks regularly tracks. The .OEX dropped a bit on Monday, and its near-term daily chart pattern is beginning to look more and more like a small consolidation prior to another bullish breakout within its long-running trend channel. The index has already made it into the lower regions of its anticipated time/price reversal zone and could begin to turn lower at any time; you should be actively protecting all existing long positions and/or scaling out to preserve profits. The exact timing of cycle highs in any market is a difficult (if not impossible) task, but the general time window gets easier to define the longer a major swing persists. All of the technicals and cycles confirm that a significant reversal and/or corrective move of the June through August 2012 rally is imminent. As always, trade wisely until we meet here again. |
Donald W. Pendergast is a financial markets consultant who offers specialized services to stock brokers and high net worth individuals who seek a better bottom line for their portfolios.
| Title: | Writer, market consultant |
| Company: | Linear Trading Systems LLC |
| Jacksonville, FL 32217 | |
| Phone # for sales: | 904-239-9564 |
| E-mail address: | lineartradingsys@gmail.com |
Traders' Resource Links | |
| Linear Trading Systems LLC has not added any product or service information to TRADERS' RESOURCE. | |
Click here for more information about our publications!
PRINT THIS ARTICLE

Request Information From Our Sponsors
- StockCharts.com, Inc.
- Candle Patterns
- Candlestick Charting Explained
- Intermarket Technical Analysis
- John Murphy on Chart Analysis
- John Murphy's Chart Pattern Recognition
- John Murphy's Market Message
- MurphyExplainsMarketAnalysis-Intermarket Analysis
- MurphyExplainsMarketAnalysis-Visual Analysis
- StockCharts.com
- Technical Analysis of the Financial Markets
- The Visual Investor
- VectorVest, Inc.
- Executive Premier Workshop
- One-Day Options Course
- OptionsPro
- Retirement Income Workshop
- Sure-Fire Trading Systems (VectorVest, Inc.)
- Trading as a Business Workshop
- VectorVest 7 EOD
- VectorVest 7 RealTime/IntraDay
- VectorVest AutoTester
- VectorVest Educational Services
- VectorVest OnLine
- VectorVest Options Analyzer
- VectorVest ProGraphics v6.0
- VectorVest ProTrader 7
- VectorVest RealTime Derby Tool
- VectorVest Simulator
- VectorVest Variator
- VectorVest Watchdog
