HOT TOPICS LIST
- MACD
- Fibonacci
- RSI
- Gann
- ADXR
- Stochastics
- Volume
- Triangles
- Futures
- Cycles
- Volatility
- ZIGZAG
- MESA
- Retracement
- Aroon
INDICATORS LIST
LIST OF TOPICS
PRINT THIS ARTICLE
by Donald W. Pendergast, Jr.
Shares of Starbucks Corp. increased by more than 770% between November 2008 and April 2012. Is its current decline just the start of a major reversal lower, or is this a good buying opportunity?
Position: N/A
Donald W. Pendergast, Jr.
Donald W. Pendergast is a financial markets consultant who offers specialized services to stock brokers and high net worth individuals who seek a better bottom line for their portfolios.
PRINT THIS ARTICLE
CYCLES
SBUX Rebound Under Way?
08/20/12 11:42:13 AMby Donald W. Pendergast, Jr.
Shares of Starbucks Corp. increased by more than 770% between November 2008 and April 2012. Is its current decline just the start of a major reversal lower, or is this a good buying opportunity?
Position: N/A
| Running the Equis - Long-Term Bearish exploration in MetaStock 11 is a quick way to find the stocks in your database that are, in most cases, underperforming the broad market indexes. There are many reasons for locating such stocks. For example, you can use the output to do further analysis to determine: 1. Which stocks may be approaching major, multicycle lows so that you can either: A. Sell out-of-the-money put options B. Scale into new positions using reverse pyramid strategies 2. Which stocks may be experiencing short-term rebounds into key resistance levels and which may be ready to fire new short signals 3. Which stocks may be breaking down even further, thus making them attractive long put purchases. Of course, there are many ways to use such a screen. Since Starbucks appeared on this list of weak stocks, it seemed like it was a good time to check out the current price cycle analysis in the stock, Knowing if SBUX was likely due to make a major, tradable low would be very valuable information, indeed -- in the hands of a skilled trader, of course. So here is the cycle chart analysis for SBUX, which offers some extremely useful information for those who trade and/or invest in this issue (Figures 1 and 2). |

|
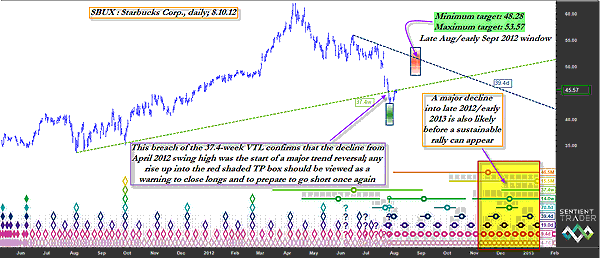
| FIGURE 1: SBUX, DAILY. While SBUX has managed to stage a bullish reversal in recent trading sessions, cyclical analysis confirms that the stock is still in a bearish mode. Any rally into the red TP box should be a warning to sell longs and/or to prepare to go short. |
| Graphic provided by: Sentient Trader. |
| |
| Obviously, SBUX's recent decline of nearly 30% from its April 2012 highs is the most striking feature of this daily cycle chart. When the stock dropped below the 37.4-week valid trendline (VTL), it confirmed that the April 2012 high was of the major variety and that a bearish trend reversal was already well under way. The other item of major importance is that while SBUX dropped into the anticipated time window for it to make a bullish bounce higher -- depicted by the green time/price (T/P) box -- it barely fell far enough to meet the minimum price target for the decline, which was 38.84. Therefore, the current bullish rebound in SBUX must be viewed with at least a bit of skepticism, at least until it manages to close back above the same 37.4-week VTL that it previously breached to the downside. If this happens, then the stock has a good shot at making it up into at least the minimum price target of the red T/P box, which is 48.28 sometime between August 26 and September 6, 2012. The stock's 46.5-month, 15.5-month, 14-week, and 19-day cycles are all falling, however, so even if SBUX can manage to make it into the red TP box, the odds are very high that this former high-flyer may resume its downtrend, falling down into the mid- to lower $30 range sometime between November 2012 and January 2013 (see the large shaded yellow box on Figure 1). |

|
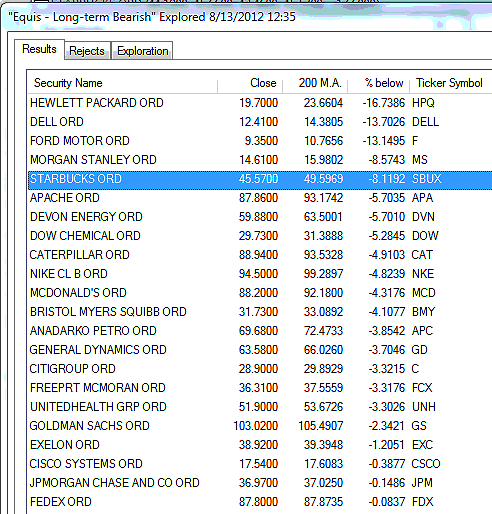
| FIGURE 2: OEX COMPONENTS. The .OEX components that are trading below their 200-day exponential moving average (EMA) as of the close on Friday, August 10, 2012. |
| Graphic provided by: MetaStock. |
| Graphic provided by: MetaStock Explorer. |
| |
| The .OEX and .SPX are still looking as if they have enough cyclical firepower to rise for the next couple of weeks (Figure 2), so it will be interesting to see if SBUX can be one of the main drivers moving the large-cap indexes to their next multicycle high in the near future. If you are considering playing a rebound in SBUX, make sure the stock closes above 46.00 and that you run a fairly close trailing stop on any long position you take, risking no more than 1% to 2% of your account equity. |
Donald W. Pendergast is a financial markets consultant who offers specialized services to stock brokers and high net worth individuals who seek a better bottom line for their portfolios.
| Title: | Writer, market consultant |
| Company: | Linear Trading Systems LLC |
| Jacksonville, FL 32217 | |
| Phone # for sales: | 904-239-9564 |
| E-mail address: | lineartradingsys@gmail.com |
Traders' Resource Links | |
| Linear Trading Systems LLC has not added any product or service information to TRADERS' RESOURCE. | |
Click here for more information about our publications!
PRINT THIS ARTICLE

Request Information From Our Sponsors
- StockCharts.com, Inc.
- Candle Patterns
- Candlestick Charting Explained
- Intermarket Technical Analysis
- John Murphy on Chart Analysis
- John Murphy's Chart Pattern Recognition
- John Murphy's Market Message
- MurphyExplainsMarketAnalysis-Intermarket Analysis
- MurphyExplainsMarketAnalysis-Visual Analysis
- StockCharts.com
- Technical Analysis of the Financial Markets
- The Visual Investor
- VectorVest, Inc.
- Executive Premier Workshop
- One-Day Options Course
- OptionsPro
- Retirement Income Workshop
- Sure-Fire Trading Systems (VectorVest, Inc.)
- Trading as a Business Workshop
- VectorVest 7 EOD
- VectorVest 7 RealTime/IntraDay
- VectorVest AutoTester
- VectorVest Educational Services
- VectorVest OnLine
- VectorVest Options Analyzer
- VectorVest ProGraphics v6.0
- VectorVest ProTrader 7
- VectorVest RealTime Derby Tool
- VectorVest Simulator
- VectorVest Variator
- VectorVest Watchdog
