HOT TOPICS LIST
- MACD
- Fibonacci
- RSI
- Gann
- ADXR
- Stochastics
- Volume
- Triangles
- Futures
- Cycles
- Volatility
- ZIGZAG
- MESA
- Retracement
- Aroon
INDICATORS LIST
LIST OF TOPICS
PRINT THIS ARTICLE
by Koos van der Merwe
Every now and then, a pattern formation attracts attention.
Position: Accumulate
Koos van der Merwe
Has been a technical analyst since 1969, and has worked as a futures and options trader with First Financial Futures in Johannesburg, South Africa.
PRINT THIS ARTICLE
RSI
Aura Minerals Shines
08/17/12 08:55:37 AMby Koos van der Merwe
Every now and then, a pattern formation attracts attention.
Position: Accumulate
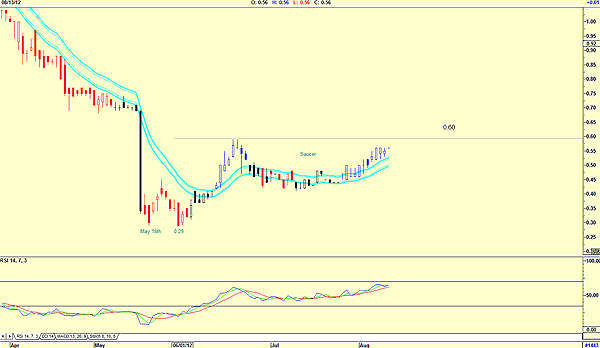
| Aura Minerals is focused on the acquisition, exploration, development, and operation of gold and base metal projects in the Americas. The portfolio includes the San Andres Gold Mine in Honduras, the Sao Francisco and Sao Vicente gold mines in Brazil, and the copper-gold-silver Aranzazu Project in Mexico. What attracted me to the chart is the saucer formation that is developing on the daily chart. A saucer formation is a pattern that suggests a strong bottom. |

|
| FIGURE 1: ORA, DAILY |
| Graphic provided by: AdvancedGET. |
| |
| Figure 1 is a daily chart showing how the share price kept falling until it bottomed on May 18 at 29 cents. From this level it rose to 0.59 cents by June 19 on an RSI buy signal and the more conservative buy signal on June 12 of the JM internal band signal at 41 cents. Since June 19, the share price has been tracing a saucer pattern, signaling the strong possibility that a share price bottom has formed. Should the price break above 60 cents, then the chart signals a buy, with a target of 80 cents. The relative strength index (RSI) is bullish, and the price is above the upper band of the JM internal band indicator, so it does look very promising. |

|
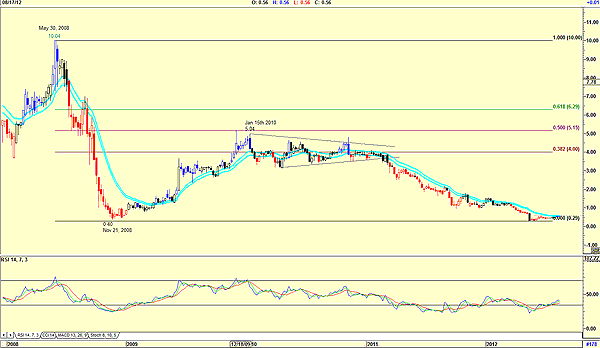
| FIGURE 2: ORA, WEEKLY |
| Graphic provided by: AdvancedGET. |
| |
| The daily chart looks promising, but what does a weekly chart say? Figure 2 shows how the price fell from a high of $10.04 on May 30, 2008, to a low of 40 cents by November 21, 2008, a disturbing drop in a short period of time. The price then rose to $5.04 by January 15, 2010, the 50% retracement level as shown by the Fibonacci pattern. What is disturbing is that from that date, a symmetrical triangle formed, but rather than break out upward, the share price broke down, falling to retest the 40-cent level. The fact that the share price seems to have found a bottom at 40 cents does suggest that the pattern on the daily chart is worth watching for a future rise. |
Has been a technical analyst since 1969, and has worked as a futures and options trader with First Financial Futures in Johannesburg, South Africa.
| Address: | 3256 West 24th Ave |
| Vancouver, BC | |
| Phone # for sales: | 6042634214 |
| E-mail address: | petroosp@gmail.com |
Click here for more information about our publications!
Comments
Date: 08/18/12Rank: 5Comment:

Request Information From Our Sponsors
- StockCharts.com, Inc.
- Candle Patterns
- Candlestick Charting Explained
- Intermarket Technical Analysis
- John Murphy on Chart Analysis
- John Murphy's Chart Pattern Recognition
- John Murphy's Market Message
- MurphyExplainsMarketAnalysis-Intermarket Analysis
- MurphyExplainsMarketAnalysis-Visual Analysis
- StockCharts.com
- Technical Analysis of the Financial Markets
- The Visual Investor
- VectorVest, Inc.
- Executive Premier Workshop
- One-Day Options Course
- OptionsPro
- Retirement Income Workshop
- Sure-Fire Trading Systems (VectorVest, Inc.)
- Trading as a Business Workshop
- VectorVest 7 EOD
- VectorVest 7 RealTime/IntraDay
- VectorVest AutoTester
- VectorVest Educational Services
- VectorVest OnLine
- VectorVest Options Analyzer
- VectorVest ProGraphics v6.0
- VectorVest ProTrader 7
- VectorVest RealTime Derby Tool
- VectorVest Simulator
- VectorVest Variator
- VectorVest Watchdog
