HOT TOPICS LIST
- MACD
- Fibonacci
- RSI
- Gann
- ADXR
- Stochastics
- Volume
- Triangles
- Futures
- Cycles
- Volatility
- ZIGZAG
- MESA
- Retracement
- Aroon
INDICATORS LIST
LIST OF TOPICS
PRINT THIS ARTICLE
by Donald W. Pendergast, Jr.
Shares of Time Warner are trading at their highest level since the summer of 2007. Are more gains ahead for this stock?
Position: N/A
Donald W. Pendergast, Jr.
Donald W. Pendergast is a financial markets consultant who offers specialized services to stock brokers and high net worth individuals who seek a better bottom line for their portfolios.
PRINT THIS ARTICLE
NEW HIGHS-NEW LOWS
TWX's New Five-Year High
08/17/12 08:42:32 AMby Donald W. Pendergast, Jr.
Shares of Time Warner are trading at their highest level since the summer of 2007. Are more gains ahead for this stock?
Position: N/A
| Shares of Time Warner (TWX) made their last major multicycle low six weeks ahead of the rest of the major US stock indexes. TWX bottomed out on August 22, 2011, at 26.26 and had already made a higher swing low at the time of the market-wide multicycle low of October 4, 2011; as the major indexes surged higher last October, TWX also tacked on some nice percentage gains. The stock made an interim high in early February 2012 before rolling over and/or consolidating, finally bottoming again on June 1, 2012, at 33.62, setting up for the powerful nine-week rally that the stock is currently enjoying -- a rally that has propelled the stock to a fresh five-year high. With TWX up by more than 27% since early June 2012, just how much higher can this media giant's common stock go before some sort of a correction kicks in? Here's a look at TWX's daily chart now. |

|
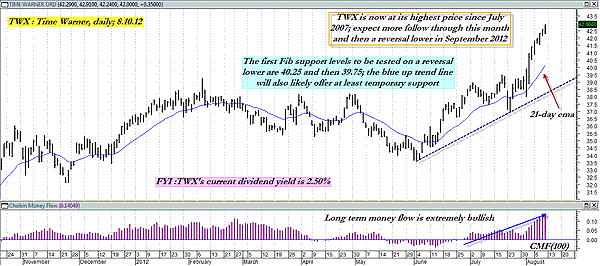
| FIGURE 1: TWX, DAILY. While a powerful trend is nothing to discount, cycles analysis suggests that TWX may be entering the terminal phase of the major rally that commenced on August 22, 2012. |
| Graphic provided by: MetaStock. |
| |
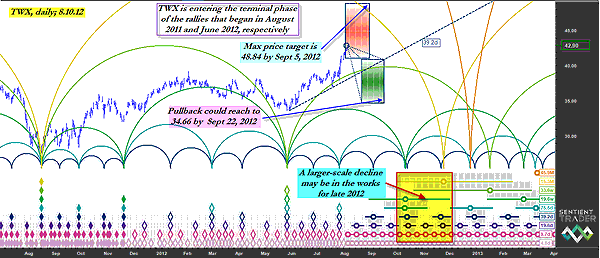
| Figure 1 shows TWX's price action in relation to its 21-day exponential moving average (EMA) and its near-term uptrend line. Clearly, TWX is enmeshed in a very powerful bullish trend, one currently being driven higher by several price cycles and strong long-term money flows. With TWX now trading at a five-year high, the bulls are pounding the table in expectation of further gains, but as we take a look at TWX's daily cycles chart, we begin to see more clearly that time is running out for the current nine-week-old rally, one that is an extension of the major rally that began on August 22, 2011. The red time/price (TP) projection box plainly shows us that the stock has already reached the minimum time/price (TP) target of 41.05 by August 8, 2012 (Figure 2), and that even if the rally continues, the probabilities are high that TWX will fail to exceed 48.84 by September 5, 2012, and a bearish trend reversal is extremely likely once this bullish swing finally exhausts. |

|
| FIGURE 2: TWX, DAILY. The red/green time/price (TP) projection boxes offer educated guesses as to the most likely reversal areas for TWX in the next five to six weeks. Note also that TWX may be setting up to make its next major multicycle low sometime in the October to December 2012 time window. |
| Graphic provided by: Sentient Trader. |
| |
| TWX's 15.3-month cycle is already in "hard down" mode, and with its 33.6-week cycle close to peaking and the 19.6-week cycle ready to turn lower, the odds are high that TWX will peak sometime within the next one to three weeks, followed by a bearish reversal. Once the reversal takes hold, cycle analysis suggests that TWX may fall as far as 34.66 by September 22, 2012; however, you should be aware that the stock has several key support levels that need to be taken out before such a sharp decline can be realized -- there is strong Fibonacci support at 40.25 and 39.75, and the blue uptrend line on the first chart will also act as some kind of a speed bump for TWX on the way down to lower valuations. |

|
| FIGURE 3: OEX COMPONENTS. The two .OEX components making new multimonth and/or multiyear highs as of August 10, 2012. |
| Graphic provided by: MetaStock. |
| Graphic provided by: Deel New Highs Screen from MetaStock 11. |
| |
| If you are a skilled intraday trader, you may still be able to milk some daytrading profits from TWX as it heads into the final leg of its major rally. The rest of us mere mortals may simply want to wait for TWX to decline into its next major multicycle low before attempting to take a long swing position, do covered calls, or sell out-of-the-money puts in this large-cap .OEX component (Figure 3). The entire market is also approaching a major bearish reversal in the next few weeks, so make sure you're already playing a strong defense to protect your portfolio. |
Donald W. Pendergast is a financial markets consultant who offers specialized services to stock brokers and high net worth individuals who seek a better bottom line for their portfolios.
| Title: | Writer, market consultant |
| Company: | Linear Trading Systems LLC |
| Jacksonville, FL 32217 | |
| Phone # for sales: | 904-239-9564 |
| E-mail address: | lineartradingsys@gmail.com |
Traders' Resource Links | |
| Linear Trading Systems LLC has not added any product or service information to TRADERS' RESOURCE. | |
Click here for more information about our publications!
PRINT THIS ARTICLE

Request Information From Our Sponsors
- StockCharts.com, Inc.
- Candle Patterns
- Candlestick Charting Explained
- Intermarket Technical Analysis
- John Murphy on Chart Analysis
- John Murphy's Chart Pattern Recognition
- John Murphy's Market Message
- MurphyExplainsMarketAnalysis-Intermarket Analysis
- MurphyExplainsMarketAnalysis-Visual Analysis
- StockCharts.com
- Technical Analysis of the Financial Markets
- The Visual Investor
- VectorVest, Inc.
- Executive Premier Workshop
- One-Day Options Course
- OptionsPro
- Retirement Income Workshop
- Sure-Fire Trading Systems (VectorVest, Inc.)
- Trading as a Business Workshop
- VectorVest 7 EOD
- VectorVest 7 RealTime/IntraDay
- VectorVest AutoTester
- VectorVest Educational Services
- VectorVest OnLine
- VectorVest Options Analyzer
- VectorVest ProGraphics v6.0
- VectorVest ProTrader 7
- VectorVest RealTime Derby Tool
- VectorVest Simulator
- VectorVest Variator
- VectorVest Watchdog
