HOT TOPICS LIST
- MACD
- Fibonacci
- RSI
- Gann
- ADXR
- Stochastics
- Volume
- Triangles
- Futures
- Cycles
- Volatility
- ZIGZAG
- MESA
- Retracement
- Aroon
INDICATORS LIST
LIST OF TOPICS
PRINT THIS ARTICLE
by Mike Carr, CMT
Corn has been the trade of the summer, and now there are related markets that look ready to follow.
Position: Buy
Mike Carr, CMT
Mike Carr, CMT, is a member of the Market Technicians Association, and editor of the MTA's newsletter, Technically Speaking. He is also the author of "Smarter Investing in Any Economy: The Definitive Guide to Relative Strength Investing," and "Conquering the Divide: How to Use Economic Indicators to Catch Stock Market Trends."
PRINT THIS ARTICLE
CHART ANALYSIS
Finding The Next Corn Trade
08/16/12 08:38:03 AMby Mike Carr, CMT
Corn has been the trade of the summer, and now there are related markets that look ready to follow.
Position: Buy
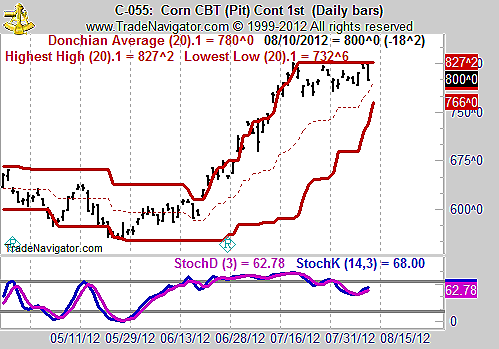
| A drought has devastated the corn crop and driven prices to all-time highs. Unfortunately, as most traders know, once a story has reached the front page of the local newspaper, the time to make the trade has long passed. Figure 1 shows that corn may actually be forming a top and this could be a time to be looking to short. That would not be unexpected from a contrarian perspective. Stock market traders are familiar with the magazine cover indicator, a contrarian tool that suggests once a story makes the front page, the market is about to turn. One of the problems with this indicator, or any contrarian strategy, is that they are frequently wrong and these types of indicators are difficult to test. Also shown in the chart are Donchian channel lines. This trading strategy is easy to test and has been shown to work in the long term. Buy signals are given when the price closes at a new 20-day high. Short signals are given on 20-day lows. Some traders are always in the market using signals as a stop and reverse system, while others close positions when prices move back to the 20-day moving average, also shown in the chart. |

|
| FIGURE 1: CORN, DAILY. Corn has gained as much as 75% in the last 10 weeks. |
| Graphic provided by: Trade Navigator. |
| |
| The stochastic indicator shows that a bearish divergence has formed while a bullish crossover has also developed. That is typical of many indicators that can give conflicting signals like that. With Donchian channels, there are no conflicting signals. Corn remains a buy. The current signal has delivered significant profits and the trade should be closed at a profit when prices reach the moving average or set a new 20-day low. With this trade likely nearer an end than a beginning, it might be best to look at related markets. |
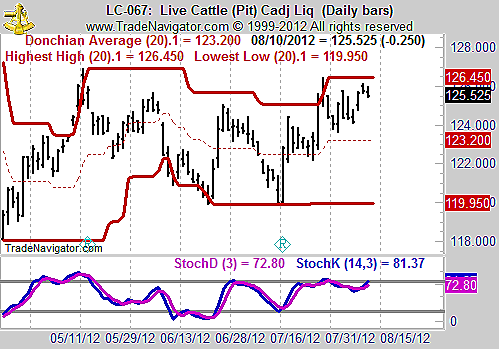
| One related market is cattle (Figure 2), which feed on corn and other grains. Higher feed prices lead many ranchers to slaughter cattle rather than face the expense. This leads to less supply of cattle later and higher prices. That makes the recent signal from a new 20-day high look timely. By almost any interpretation, the stochastic is also bullish. |

|
| FIGURE 2: CATTLE, DAILY. This chart of cattle shows a recent Donchian buy signal. |
| Graphic provided by: Trade Navigator. |
| |
| Testing shows that Donchian signals are profitable on cattle in the long run; however, only 38% of all trades have been profitable. Long and short trades have similar percentages of wins, but long trades have been much more profitable over the long run. The last two trade signals have been losses, and after that, the next trade has been a winner about 48% of the time, which is a slight improvement in the odds. Average winning trades last about three months, while losers last an average of one month. The most recent signal was less than two weeks ago. |
| While traders should always follow system rules if they are system traders, they often act with greater confidence when there is a logical, fundamental reason that supports the latest signal. That is the case with cattle, making this contract a way to benefit for those who may have missed the runup in corn. |
Mike Carr, CMT, is a member of the Market Technicians Association, and editor of the MTA's newsletter, Technically Speaking. He is also the author of "Smarter Investing in Any Economy: The Definitive Guide to Relative Strength Investing," and "Conquering the Divide: How to Use Economic Indicators to Catch Stock Market Trends."
| Website: | www.moneynews.com/blogs/MichaelCarr/id-73 |
| E-mail address: | marketstrategist@gmail.com |
Click here for more information about our publications!
PRINT THIS ARTICLE

Request Information From Our Sponsors
- VectorVest, Inc.
- Executive Premier Workshop
- One-Day Options Course
- OptionsPro
- Retirement Income Workshop
- Sure-Fire Trading Systems (VectorVest, Inc.)
- Trading as a Business Workshop
- VectorVest 7 EOD
- VectorVest 7 RealTime/IntraDay
- VectorVest AutoTester
- VectorVest Educational Services
- VectorVest OnLine
- VectorVest Options Analyzer
- VectorVest ProGraphics v6.0
- VectorVest ProTrader 7
- VectorVest RealTime Derby Tool
- VectorVest Simulator
- VectorVest Variator
- VectorVest Watchdog
- StockCharts.com, Inc.
- Candle Patterns
- Candlestick Charting Explained
- Intermarket Technical Analysis
- John Murphy on Chart Analysis
- John Murphy's Chart Pattern Recognition
- John Murphy's Market Message
- MurphyExplainsMarketAnalysis-Intermarket Analysis
- MurphyExplainsMarketAnalysis-Visual Analysis
- StockCharts.com
- Technical Analysis of the Financial Markets
- The Visual Investor
