

HOT TOPICS LIST
- MACD
- Fibonacci
- RSI
- Gann
- ADXR
- Stochastics
- Volume
- Triangles
- Futures
- Cycles
- Volatility
- ZIGZAG
- MESA
- Retracement
- Aroon
INDICATORS LIST
LIST OF TOPICS
PRINT THIS ARTICLE
by Donald W. Pendergast, Jr.
Shares of Chevron Corp. have posted a fresh 52-week high; is there much upside potential remaining before a correction?
Position: N/A
Donald W. Pendergast, Jr.
Donald W. Pendergast is a financial markets consultant who offers specialized services to stock brokers and high net worth individuals who seek a better bottom line for their portfolios.
PRINT THIS ARTICLE
NEW HIGHS-NEW LOWS
Chevron Corp. : A New 52-Week High
08/15/12 02:22:48 PMby Donald W. Pendergast, Jr.
Shares of Chevron Corp. have posted a fresh 52-week high; is there much upside potential remaining before a correction?
Position: N/A
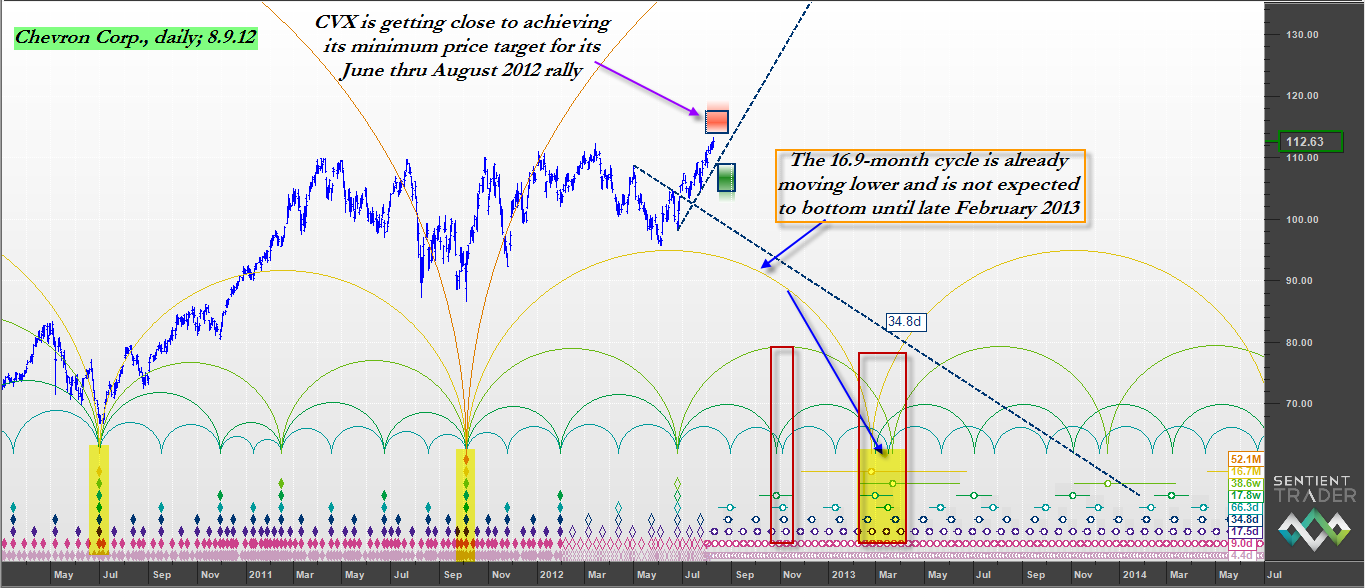
| Since it made a a multicycle low on June 4, 2012 shares of Chevron Corp. (CVX) have risen in a relatively smooth channel, with the stock up nearly 18% in a nine week period. Many other stocks in the oil exploration/production and oil services industries are also up nicely since early June 2012, but does Chevron have the momentum to trend even higher until the .OEX finally decides to correct its own massive run higher since October 2011? Here's a look at the daily cycles chart in Chevron Corp. for some answers. |
|
| While the length of the nominal 16.9-month cycle in CVX does expand and contract, at present it appears that the first quarter of 2013 is when traders and investors should anticipate this key long term cycle to bottom. |
| Graphic provided by: Sentient Trader. |
| |
| The simple and quick answer to the question regarding CVX's ability to post more gains before it and/or the .OEX go into a proportional correction or trend reversal is this: "Yes, CVX has the potential to run a few dollars higher between now and the last week of August 2012, but the cyclical stage is already set for the stock to experience a modest correction by late October/early November 2012 with the chance of an even larger decline by February/March 2013." Here's why - the 16.9 month cycle in CVX has been one of the primary drivers for the three distinct bullish phases the stock has experienced since making a major multicycle low in November 2008 (as crude oil was falling from $145 to $33 per barrel). This same cycle bottomed again in July 2010 - a couple of months late - and then again in early October 2011, this time nearly two months early. Cycles can and do expand and contract, but over long periods of time do tend to form fairly reliable patterns that skilled traders and technicians can use to anticipate bottoming/topping time windows with a useful degree of accuracy. As it stands now, the same 16.9 month cycle is once again due to bottom (along with seven other price cycles) sometime around the last week of February 2013. This large degree cycle has already begun to turn lower, as have the 66-day, 18-day and 9-day cycles. Conversely, CVX's 52-month, 39-week and 18-week cycles are still moving higher, and these three cycles are the ones currently powering the move higher from its early June 2012 lows. |
|
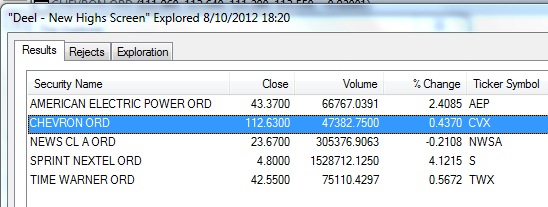
| The 5 .OEX component stocks making new multimonth highs for August 9, 2012. |
| Graphic provided by: MetaStock. |
| Graphic provided by: Deel New Highs Screen from Metastock v.11. |
| |
| Near term, CVX has already entered the general time window in which to expect a reversal lower, but it has not yet reached its minimum price target of 113.93; its maximum price target is 117.41 by August 29, 2012. The red shaded time/price (TP) box on the chart shows the general time window and price range in which to anticipated CVX's upcoming reversal to occur; the green TP box is suggesting that on CVX's next leg down, the stock could drop down as far as 104.60 by no later than September 6, 2012. One clue that the stock is indeed heading south will be when the up sloping dashed blue trend line (known as a VTL or valid trend line) is finally breached on a daily close to the downside. Such a break will confirm that the 34.8-day cycle high is confirmed and that a trend reversal lower is underway. While it is too early to actually project where CVX will be trading once it completes its anticipated Q1 multicycle low, the stock has major support levels at 95.78, 92.29 and 86.68 and any of these could help provide a foundation for future cycle lows as CVX attempts to bottom sometime early next year. Playing CVX now looks fairly easy; if you are a skilled option trader, consider selling out of the money calls in the stock; the September '12 $120 calls are selling for about $.25 each and have deltas of about .40 and September '12 $110 puts are selling for $1.56. Obviously, selling naked calls is a lot more risky that buying slightly out-of-the-money puts, but if you are good at spotting distribution patterns, money flow and momentum divergences (and know how to put the cycles data you've been given here to proper use), then selling calls becomes a more rational and potentially profitable pastime. Just use strict risk control measures, keeping your max account risk to 2% or less, no matter how convinced you may be of a bearish reversal in CVX or any other stock. |
Donald W. Pendergast is a financial markets consultant who offers specialized services to stock brokers and high net worth individuals who seek a better bottom line for their portfolios.
| Title: | Writer, market consultant |
| Company: | Linear Trading Systems LLC |
| Jacksonville, FL 32217 | |
| Phone # for sales: | 904-239-9564 |
| E-mail address: | lineartradingsys@gmail.com |
Traders' Resource Links | |
| Linear Trading Systems LLC has not added any product or service information to TRADERS' RESOURCE. | |
Click here for more information about our publications!
PRINT THIS ARTICLE

Request Information From Our Sponsors
- StockCharts.com, Inc.
- Candle Patterns
- Candlestick Charting Explained
- Intermarket Technical Analysis
- John Murphy on Chart Analysis
- John Murphy's Chart Pattern Recognition
- John Murphy's Market Message
- MurphyExplainsMarketAnalysis-Intermarket Analysis
- MurphyExplainsMarketAnalysis-Visual Analysis
- StockCharts.com
- Technical Analysis of the Financial Markets
- The Visual Investor
- VectorVest, Inc.
- Executive Premier Workshop
- One-Day Options Course
- OptionsPro
- Retirement Income Workshop
- Sure-Fire Trading Systems (VectorVest, Inc.)
- Trading as a Business Workshop
- VectorVest 7 EOD
- VectorVest 7 RealTime/IntraDay
- VectorVest AutoTester
- VectorVest Educational Services
- VectorVest OnLine
- VectorVest Options Analyzer
- VectorVest ProGraphics v6.0
- VectorVest ProTrader 7
- VectorVest RealTime Derby Tool
- VectorVest Simulator
- VectorVest Variator
- VectorVest Watchdog