HOT TOPICS LIST
- MACD
- Fibonacci
- RSI
- Gann
- ADXR
- Stochastics
- Volume
- Triangles
- Futures
- Cycles
- Volatility
- ZIGZAG
- MESA
- Retracement
- Aroon
INDICATORS LIST
LIST OF TOPICS
PRINT THIS ARTICLE
by Gary Grosschadl
This volatile diamond hunter is starting to show very early signs of better times ahead by virtue of its contracting triangle formation and the DI (directional movement indicator).
Position: N/A
Gary Grosschadl
Independent Canadian equities trader and technical analyst based in Peterborough
Ontario, Canada.
PRINT THIS ARTICLE
CHART ANALYSIS
Will This Diamond Play Sparkle Once Again?
07/08/02 08:39:59 AMby Gary Grosschadl
This volatile diamond hunter is starting to show very early signs of better times ahead by virtue of its contracting triangle formation and the DI (directional movement indicator).
Position: N/A
| Ashton Mining has found diamonds in Quebec and is continuing more sampling and exploration. If traders and speculators begin to think Ashton's chances for finding an economic discovery are improving, then this play will heat up. |
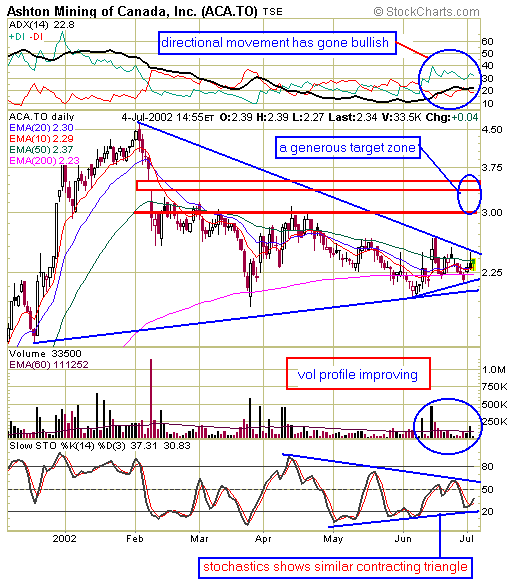
| But enough rumour and innuendo, what does the chart suggest? There are some interesting developments here. First of all there are two contracting triangles at work, the smaller one developing the past month as shown on the chart. What's noteworthy about these triangles is their eventual outcome. As the pattern develops they tighten up as more and more traders start to position themselves for an outcome. The triangle is neither bullish or bearish until it breaks out of the pattern. However there are several bullish clues besides the improving volume profile. |

|
| Graphic provided by: stockcharts.com. |
| |
| The ADX (average directional movement indicator), has turned decidedly bullish after being trendless for several months. Witness the recent bullish DI crossover that has bullish power exerting some control. Note that the ADX line has finally moved in between the bullish DI setup and is in a rising trend going above 20. This is the ideal ADX setup to tip you off to a bullish trend beginning: +DI over -DI and ADX in between and rising. Stochastics in the short-term are also bullish and you can see the same triangle pattern as well. Another bullish clue is the location of the very important 200-day EMA. Ashton is resting just above its 200-day EMA of 2.23. This is important support and is the ideal launching pad for a protracted move upwards. |
| So where do we go from here? Watch for signs of a higher volume move past the upper trendline into the 2.50s for starters. With exceptional volume the first resistance level of 2.65 (the top of that previous large red candlestick) should be beaten as the stock moves towards more serious resistance. |
| The outlined target zone incorporates the previous congestion zone, around $3 and has previous gap resistance at 3.35 - 3.50. With extreme bullishness and huge volumes, even these levels can be beaten but it is wise to have a prudent target in sight. The downside scenario would be a move to violate the triangle's lower trendline. This negates all bullish views. This diamond play has the potential to dazzle but as always...it is not without risk. |
Independent Canadian equities trader and technical analyst based in Peterborough
Ontario, Canada.
| Website: | www.whatsonsale.ca/financial.html |
| E-mail address: | gwg7@sympatico.ca |
Click here for more information about our publications!
Comments
Date: 07/13/02Rank: 3Comment:
Date: 07/14/02Rank: 4Comment: I would like to see all authors reveal their positions in securities discussed.

Request Information From Our Sponsors
- StockCharts.com, Inc.
- Candle Patterns
- Candlestick Charting Explained
- Intermarket Technical Analysis
- John Murphy on Chart Analysis
- John Murphy's Chart Pattern Recognition
- John Murphy's Market Message
- MurphyExplainsMarketAnalysis-Intermarket Analysis
- MurphyExplainsMarketAnalysis-Visual Analysis
- StockCharts.com
- Technical Analysis of the Financial Markets
- The Visual Investor
- VectorVest, Inc.
- Executive Premier Workshop
- One-Day Options Course
- OptionsPro
- Retirement Income Workshop
- Sure-Fire Trading Systems (VectorVest, Inc.)
- Trading as a Business Workshop
- VectorVest 7 EOD
- VectorVest 7 RealTime/IntraDay
- VectorVest AutoTester
- VectorVest Educational Services
- VectorVest OnLine
- VectorVest Options Analyzer
- VectorVest ProGraphics v6.0
- VectorVest ProTrader 7
- VectorVest RealTime Derby Tool
- VectorVest Simulator
- VectorVest Variator
- VectorVest Watchdog
