HOT TOPICS LIST
- MACD
- Fibonacci
- RSI
- Gann
- ADXR
- Stochastics
- Volume
- Triangles
- Futures
- Cycles
- Volatility
- ZIGZAG
- MESA
- Retracement
- Aroon
INDICATORS LIST
LIST OF TOPICS
PRINT THIS ARTICLE
by Donald W. Pendergast, Jr.
The S&P 100 has enjoyed a bullish run since early June 2012. Can this rally continue much longer?
Position: N/A
Donald W. Pendergast, Jr.
Donald W. Pendergast is a financial markets consultant who offers specialized services to stock brokers and high net worth individuals who seek a better bottom line for their portfolios.
PRINT THIS ARTICLE
CYCLES
.OEX Current Cycle Outlook
08/14/12 08:50:21 AMby Donald W. Pendergast, Jr.
The S&P 100 has enjoyed a bullish run since early June 2012. Can this rally continue much longer?
Position: N/A
| Having risen by as much as 11.67% between June 4, 2012, and August 7, 2012, of the Standard & Poor's 100 (.OEX), the current technical state of this key large-cap stock barometer is still looking healthy and its prospects for further gains in the next month are also looking very favorable. However, price cycle analysis suggests that some big changes may be looming for this key index between now and first-quarter 2013. Here's a closer look at the daily cycles chart for the .OEX (Figures 1 and 2). |

|
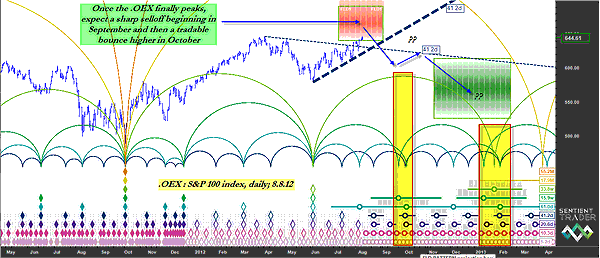
| FIGURE 1: OEX, DAILY. This daily bar chart depicting the primary cycles in the .OEX is providing traders and investors with an early warning that the index is very likely to go into corrective mode between late August 2012 and first-quarter 2013. |
| Graphic provided by: Sentient Trader. |
| |
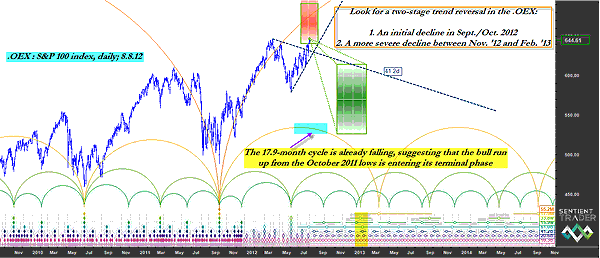
| Glancing at the cycles chart for the .OEX in some ways confirms the obvious -- namely, that the October 4, 2011, and June 4, 2012, swing lows in this large-cap index were of a high-degree, multicycle variety; the substantial rallies coming out of each low are proof of that. What is less obvious is that the 17.9-month cycle in the .OEX -- the prime bullish driver of the entire rally since October 2011 -- has apparently peaked and begun to gradually turn lower, and that the odds for bullish gains beyond August 2012 are becoming slimmer every day. While this cyclical decline in no way is indicative of a major bear market move, it is confirming that the .OEX is due for a proportional correction of the current 10-month old bull market. The red time/price (TP) projection box on the chart confirms that the index has already achieved its minimum TP target zone (640.87), although there is a small possibility that it could make another surge higher to the maximum TP target of 691.19 by no later than September 4, 2012. Once the .OEX peaks and then turns lower, then mid-September to mid-October becomes the next likely multicycle low time window (see vertical yellow shaded area). However, since a larger-degree multicycle low is anticipated to form in the first quarter of 2013, the bullish bounce up from the upcoming September/October 2012 multicycle low probably won't retrace too much of the soon-to-be-seen September decline, and a more serious cyclical decline should then pull the .OEX down to at least 614.15 and possibly as low as 526.27 between November 9, 2012, and February 17, 2013 -- see the large green TP zone for an idea of what may be ahead for this large-cap index. |

|
| FIGURE 2: OEX, DAILY. Resizing the chart also shows that the 17.9-month cycle has already turned lower and is not anticipated to bottom out until late March 2013. |
| Graphic provided by: Sentient Trader. |
| |
| While it's true that the current TP targets for the green zone are wide, remember that this kind of long-term analysis isn't intended to provide pinpoint timing accuracy in the markets, but it is better suited as a tool to help investors and traders keep abreast of the probability/timing/extent of future anticipated moves in the .OEX. Right now, the red TP box is the main one to focus on, since it is confirming that the .OEX has already satisfied the general TP targets for the latest 10-month rally and can conceivably begin a corrective move at any time. Traders and investors need to scale back their position risk by scaling out, taking partial profits, and running closer trailing stops. One way to confirm the start of the upcoming correction is to see if the August 2, 2012, swing low of 624.73 is breached. If that happens, you should immediately close all open longs and wait for the correction to play out before going long again. Skilled short traders might look to sell near-term, out-of-the-money .OEX call options, using the eventual multicycle high as a stop-loss for such an option credit play. So the bottom line here is this. Enjoy the remainder of the bull run in the .OEX even as you pull in the reins on risk and prepare for the possibility of some dark and stormy days between late August 2012 and mid-October 2012. |
Donald W. Pendergast is a financial markets consultant who offers specialized services to stock brokers and high net worth individuals who seek a better bottom line for their portfolios.
| Title: | Writer, market consultant |
| Company: | Linear Trading Systems LLC |
| Jacksonville, FL 32217 | |
| Phone # for sales: | 904-239-9564 |
| E-mail address: | lineartradingsys@gmail.com |
Traders' Resource Links | |
| Linear Trading Systems LLC has not added any product or service information to TRADERS' RESOURCE. | |
Click here for more information about our publications!
Comments
Date: 08/16/12Rank: 5Comment:

Request Information From Our Sponsors
- StockCharts.com, Inc.
- Candle Patterns
- Candlestick Charting Explained
- Intermarket Technical Analysis
- John Murphy on Chart Analysis
- John Murphy's Chart Pattern Recognition
- John Murphy's Market Message
- MurphyExplainsMarketAnalysis-Intermarket Analysis
- MurphyExplainsMarketAnalysis-Visual Analysis
- StockCharts.com
- Technical Analysis of the Financial Markets
- The Visual Investor
- VectorVest, Inc.
- Executive Premier Workshop
- One-Day Options Course
- OptionsPro
- Retirement Income Workshop
- Sure-Fire Trading Systems (VectorVest, Inc.)
- Trading as a Business Workshop
- VectorVest 7 EOD
- VectorVest 7 RealTime/IntraDay
- VectorVest AutoTester
- VectorVest Educational Services
- VectorVest OnLine
- VectorVest Options Analyzer
- VectorVest ProGraphics v6.0
- VectorVest ProTrader 7
- VectorVest RealTime Derby Tool
- VectorVest Simulator
- VectorVest Variator
- VectorVest Watchdog
