HOT TOPICS LIST
- MACD
- Fibonacci
- RSI
- Gann
- ADXR
- Stochastics
- Volume
- Triangles
- Futures
- Cycles
- Volatility
- ZIGZAG
- MESA
- Retracement
- Aroon
INDICATORS LIST
LIST OF TOPICS
PRINT THIS ARTICLE
by Donald W. Pendergast, Jr.
Shares of Comcast CL A may be ready to turn lower, but only for a brief retest of support before turning higher.
Position: N/A
Donald W. Pendergast, Jr.
Donald W. Pendergast is a financial markets consultant who offers specialized services to stock brokers and high net worth individuals who seek a better bottom line for their portfolios.
PRINT THIS ARTICLE
CYCLES
A Drop Before A Pop For Comcast CL A?
08/10/12 09:15:55 AMby Donald W. Pendergast, Jr.
Shares of Comcast CL A may be ready to turn lower, but only for a brief retest of support before turning higher.
Position: N/A
| Comcast Class A shares (CMCSA) have had a very nice rally since making a major multicycle low in early October 2011; the shares are up by 77% since then, and the stock still has an impressive set of technicals that suggest more upside is possible. In the near future, however, price cycle analysis reveals that the most likely direction for the stock is toward lower valuations before rebounding toward new highs once again. Here's a closer look at CMCSA (Figures 1 and 2). |

|
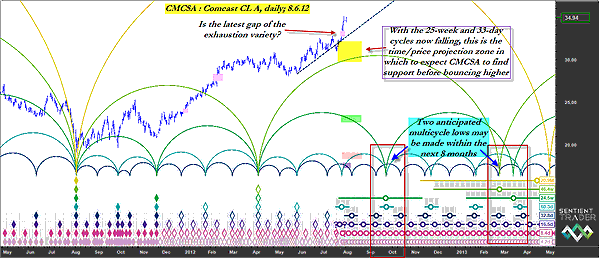
| FIGURE 1: CMCSA, DAILY. Whenever an exhaustion gap prints after a sustained bullish rally in a stock, wise traders will want to analyze the stock's long-term money flow trend for bearish divergence with price as well as its key price cycles. The technical evidence strongly suggests that CMCSA is going to turn down very soon. |
| Graphic provided by: Sentient Trader. |
| |
| Even a cursory glance at the daily chart of CMCSA informs traders and investors that this stock is still riding the in the updraft of several powerful price cycles. The 60-day and 46-week cycles have been doing most of the heavy lifting as of late, but with the 25-week and 33-day cycles already making significant turns lower, it appears that these are the two cycles that are going to control CMCSA's price direction for the next seven to 10 trading sessions. Cycles analysis further reveals that CMCSA may pull back as far as $30.06 before the current cycle configuration needs to be re-interpreted; this pullback should be complete by no later than August 22, 2012. One troubling aspect of CMCSA's daily chart is the most recent gap (see pink shaded boxes); technically, this looks to be an exhaustion gap -- the kind seen near the ends of long uptrends, and which frequently are followed by a near-parabolic final rise before a major trend reversal. Clearly, CMCSA's near-term line of least resistance appears to be toward the mid-to-lower $30 price range. |

|
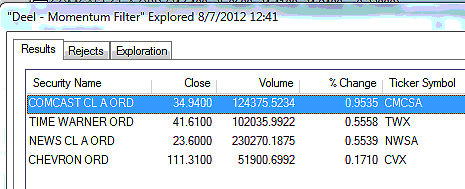
| FIGURE 2: BULLISH MOMENTUM. Four large-cap stocks exhibiting powerful long-term bullish momentum; all were identified by the Deel momentum filter exploration in MetaStock 11. |
| Graphic provided by: MetaStock. |
| Graphic provided by: MetaStock Explorer. |
| |
| Long-term money flow (not shown) in CMCSA is very strong and is also well above its zero line, although there is a mild amount of negative price/money flow divergence evident on its daily chart. Cycle chart analysis also shows us that a more meaningful major low is expected by October 2012 and then another during the first quarter of 2013. So, according to the entire mix of technicals, CMCSA's most likely pathway might play out something like this: 1. A pullback down to the mid- to lower $30 range, followed by 2. A retest of the August 3, 2011, high of $35.09, which will then be followed by 3. A more major corrective move, one that will likely bring the stock to the $30 level this fall and below $30 by March 2013. |
| Given all of the above, covered calls are not advised, and any traders or investors currently long CMCSA should already be implementing a profit-taking and/or exit strategy. In fact, if you are a skilled short seller, look for confirmed short sell signals from a variety of short-term mechanical trading systems during the next few trading sessions. This stock might make a swift, sharp move down between now and the third week of August and could offer savvy traders a variety of profitable short trading ops. Always try to use less risk when trading short (perhaps no more than 1% of your account value) to avoid the damage that overnight short squeezes can inflict on your trading account and trading psychology. |
Donald W. Pendergast is a financial markets consultant who offers specialized services to stock brokers and high net worth individuals who seek a better bottom line for their portfolios.
| Title: | Writer, market consultant |
| Company: | Linear Trading Systems LLC |
| Jacksonville, FL 32217 | |
| Phone # for sales: | 904-239-9564 |
| E-mail address: | lineartradingsys@gmail.com |
Traders' Resource Links | |
| Linear Trading Systems LLC has not added any product or service information to TRADERS' RESOURCE. | |
Click here for more information about our publications!
PRINT THIS ARTICLE

|

Request Information From Our Sponsors
- StockCharts.com, Inc.
- Candle Patterns
- Candlestick Charting Explained
- Intermarket Technical Analysis
- John Murphy on Chart Analysis
- John Murphy's Chart Pattern Recognition
- John Murphy's Market Message
- MurphyExplainsMarketAnalysis-Intermarket Analysis
- MurphyExplainsMarketAnalysis-Visual Analysis
- StockCharts.com
- Technical Analysis of the Financial Markets
- The Visual Investor
- VectorVest, Inc.
- Executive Premier Workshop
- One-Day Options Course
- OptionsPro
- Retirement Income Workshop
- Sure-Fire Trading Systems (VectorVest, Inc.)
- Trading as a Business Workshop
- VectorVest 7 EOD
- VectorVest 7 RealTime/IntraDay
- VectorVest AutoTester
- VectorVest Educational Services
- VectorVest OnLine
- VectorVest Options Analyzer
- VectorVest ProGraphics v6.0
- VectorVest ProTrader 7
- VectorVest RealTime Derby Tool
- VectorVest Simulator
- VectorVest Variator
- VectorVest Watchdog
