HOT TOPICS LIST
- MACD
- Fibonacci
- RSI
- Gann
- ADXR
- Stochastics
- Volume
- Triangles
- Futures
- Cycles
- Volatility
- ZIGZAG
- MESA
- Retracement
- Aroon
INDICATORS LIST
LIST OF TOPICS
PRINT THIS ARTICLE
by Chaitali Mohile
The narrowing range of NetGear could mean it is getting ready for a breakout. But in which direction will the stock break?
Position: N/A
Chaitali Mohile
Active trader in the Indian stock markets since 2003 and a full-time writer. Trading is largely based upon technical analysis.
PRINT THIS ARTICLE
BREAKOUTS
NTGR Undergoing Bullish Breakout?
08/09/12 11:20:22 AMby Chaitali Mohile
The narrowing range of NetGear could mean it is getting ready for a breakout. But in which direction will the stock break?
Position: N/A
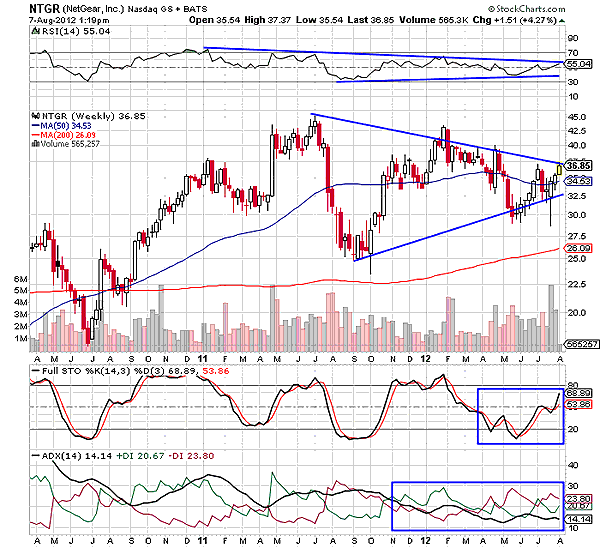
| NetGear (NTGR) is forming a symmetrical triangle on its weekly time frame chart (Figure 1). In this triangular formation, the price movement is controlled by the two converging trendlines of the pattern. The trendlines converge because of the series of lower highs and higher lows formed in the pattern. The upper resistance trendline restricts bullish movements, whereas the lower trendline offer support to the stock, protecting the stock from bearish influence. As the pattern proceeds, the price range narrows, resulting in a breakout. However, the direction of the breakout is uncertain. Unlike the other two triangles (ascending and descending), we cannot anticipate the breakout direction for the symmetrical triangle. NTGR has been moving within the triangle for almost a year. The trading range of the stock has narrowed down to five points. |

|
| FIGURE 1: NTGR, WEEKLY |
| Graphic provided by: StockCharts.com. |
| |
| Currently, the stock is showing the possibility of a bullish breakout. Buying volume has increased suddenly. But for the confirmed bullish breakout, the relative strength index (RSI) (14) has to surge above 55 levels, breaching the previous high trend. This will generate fresh bullish strength in the rally as the oscillator was forming a series of lower highs. In addition, the average directional index (ADX) (14) in Figure 1 has to climb above 20 levels. However, the current positions of the RSI (14), ADX (14), and the full stochastic (14,3,3) do not support the bullish breakout of the symmetrical triangle. Therefore, traders have to wait for the confirmed breakout direction. |

|
| FIGURE 2: NTGR, MONTHLY |
| Graphic provided by: StockCharts.com. |
| |
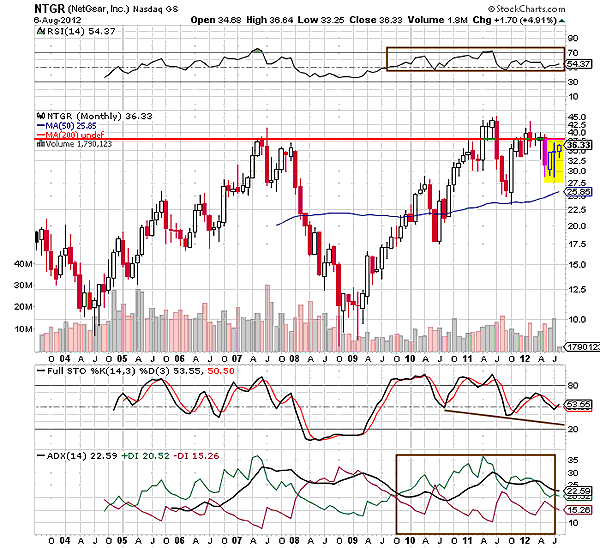
| The monthly time frame chart (Figure 2) would further act as a guide for the breakout direction and target. The red line in Figure 2 shows robust resistance at 37.5 levels. Earlier, the rallies had thrice plunged from this resistance level. Though NTGR violated this resistance, it failed to establish support at 37.5. The three candlesticks (see the yellow block) show slight ascending price movement. An uptrend indicated by the ADX (14) is developing, the stochastic oscillator is struggling in an overbought area, and the RSI (14) is stuck in an overbought region between 50 and 70 levels. |
| In this scenario, NTGR is once again likely to challenge and breach its resistance line. However, it would be difficult for the stock to sustain above 37.5 levels. The indicators are not steady in their bullish zones. The stock would need robust bullish force before resistance can convert to support. |
| The symmetrical triangle is not likely to break in an upward direction in succeeding trading sessions. The indicators have not turned completely bullish to initiate a fresh bullish breakout rally. However, the breakout would open the best trading opportunity for buyers or sellers, depending upon the breakout direction. The bullish breakout would be confirmed only above 45 levels. Hence, NTGR can be placed in the top five stocks of your watchlist. |
Active trader in the Indian stock markets since 2003 and a full-time writer. Trading is largely based upon technical analysis.
| Company: | Independent |
| Address: | C1/3 Parth Indraprasth Towers. Vastrapur |
| Ahmedabad, Guj 380015 | |
| E-mail address: | chaitalimohile@yahoo.co.in |
Traders' Resource Links | |
| Independent has not added any product or service information to TRADERS' RESOURCE. | |
Click here for more information about our publications!
PRINT THIS ARTICLE

Request Information From Our Sponsors
- StockCharts.com, Inc.
- Candle Patterns
- Candlestick Charting Explained
- Intermarket Technical Analysis
- John Murphy on Chart Analysis
- John Murphy's Chart Pattern Recognition
- John Murphy's Market Message
- MurphyExplainsMarketAnalysis-Intermarket Analysis
- MurphyExplainsMarketAnalysis-Visual Analysis
- StockCharts.com
- Technical Analysis of the Financial Markets
- The Visual Investor
- VectorVest, Inc.
- Executive Premier Workshop
- One-Day Options Course
- OptionsPro
- Retirement Income Workshop
- Sure-Fire Trading Systems (VectorVest, Inc.)
- Trading as a Business Workshop
- VectorVest 7 EOD
- VectorVest 7 RealTime/IntraDay
- VectorVest AutoTester
- VectorVest Educational Services
- VectorVest OnLine
- VectorVest Options Analyzer
- VectorVest ProGraphics v6.0
- VectorVest ProTrader 7
- VectorVest RealTime Derby Tool
- VectorVest Simulator
- VectorVest Variator
- VectorVest Watchdog
