HOT TOPICS LIST
- MACD
- Fibonacci
- RSI
- Gann
- ADXR
- Stochastics
- Volume
- Triangles
- Futures
- Cycles
- Volatility
- ZIGZAG
- MESA
- Retracement
- Aroon
INDICATORS LIST
LIST OF TOPICS
PRINT THIS ARTICLE
by Gary Grosschadl
Research In Motion's (RIM) chart shows what counts in the short term. RIM has posted a smaller-than-expected loss in its fiscal first quarter of 2002, but also lowered financial guidance for the overall year.
Position: N/A
Gary Grosschadl
Independent Canadian equities trader and technical analyst based in Peterborough
Ontario, Canada.
PRINT THIS ARTICLE
CHART ANALYSIS
Has Research In Motion Beaten The Bear Rally Blues?
07/08/02 08:22:06 AMby Gary Grosschadl
Research In Motion's (RIM) chart shows what counts in the short term. RIM has posted a smaller-than-expected loss in its fiscal first quarter of 2002, but also lowered financial guidance for the overall year.
Position: N/A
| The advantage to charts is that the market gives you a clearer short-term prognosis than the often ambiguous fundamental information. Clearly the market perceives the latest results as good news. The question is, will it last? |
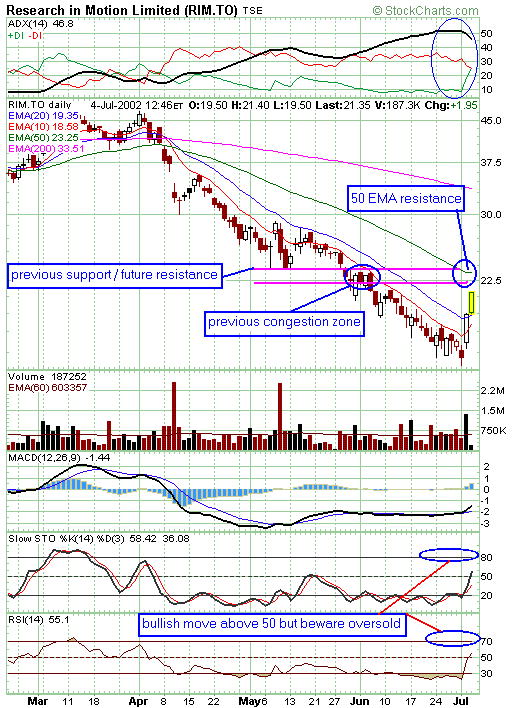
| During the big downturn following RIM's double top, the stock has been marking typical failed (bear) rallies along the way. Once a stock falls below the weight of too many moving averages you can be assured that the downtrend is strong. All of these failed rallies have ended between the 10- and 20-day EMAs. In fact the 20-day EMA line has been only briefly touched once. |

|
| Graphic provided by: stockcharts.com. |
| |
| Now there has been an abrupt change in trader sentiment with a very bullish one-day thrust on very good volume that passed both of the above mentioned moving averages. The chart shows two indicators giving some advance warning that bullish action lay close. |
| The ADX indicator showed one of my favorite patterns: "overheated ADX pushing for DI reversal." The ADX values were high for some time but when they climbed to 50, things were definitely overheated. The critical item is the converging of the DIs as the ADX shows signs of topping out (flatenning out or starting to turn down). Once you see the price action respond then look for ADX confirmation in the form of an actual DI crossover. This looks imminent now. The other indicator that hinted at a bullish turn was MACD (moving average convergence/divergence). Even though it looked weak, there was positive divergence as this indicator refused to go lower with the stock's price pattern. This was not a very strong pattern as it took too long to develop and other indicators were not confirming with their own divergences. Still this combined with the ADX profile was enough to make an observant trader take note. |
| Now, more importantly, where does this stock go from here? This chart looks sufficiently bullish to make the circled target zone. However once there we have three reasons for the stock to either take a breather or retrace to lower levels. The upper limit of the target zone is marked by the 50-day EMA resistance and a previous support level around 23.25. The chart also shows a previous congestion zone around the 22.50 mark. This also corresponds with the likelihood of RSI and stochastics hitting overbought territory. This target zone of 22.50 - 23.25 should be closely watched by short-term traders going forward, either as profit-taking opportunities or shorting possibilities (should suitable conditions present themselves), for the aggressive trader with a higher risk tolerance. This does not preclude an exceptional move past this congestion zone, however I don't like the odds here. Longer term traders should note that RIM is still a long way off its 200-day EMA of 33.50, so the longer-term trend has not yet changed. |
Independent Canadian equities trader and technical analyst based in Peterborough
Ontario, Canada.
| Website: | www.whatsonsale.ca/financial.html |
| E-mail address: | gwg7@sympatico.ca |
Click here for more information about our publications!
PRINT THIS ARTICLE

Request Information From Our Sponsors
- StockCharts.com, Inc.
- Candle Patterns
- Candlestick Charting Explained
- Intermarket Technical Analysis
- John Murphy on Chart Analysis
- John Murphy's Chart Pattern Recognition
- John Murphy's Market Message
- MurphyExplainsMarketAnalysis-Intermarket Analysis
- MurphyExplainsMarketAnalysis-Visual Analysis
- StockCharts.com
- Technical Analysis of the Financial Markets
- The Visual Investor
- VectorVest, Inc.
- Executive Premier Workshop
- One-Day Options Course
- OptionsPro
- Retirement Income Workshop
- Sure-Fire Trading Systems (VectorVest, Inc.)
- Trading as a Business Workshop
- VectorVest 7 EOD
- VectorVest 7 RealTime/IntraDay
- VectorVest AutoTester
- VectorVest Educational Services
- VectorVest OnLine
- VectorVest Options Analyzer
- VectorVest ProGraphics v6.0
- VectorVest ProTrader 7
- VectorVest RealTime Derby Tool
- VectorVest Simulator
- VectorVest Variator
- VectorVest Watchdog
