HOT TOPICS LIST
- MACD
- Fibonacci
- RSI
- Gann
- ADXR
- Stochastics
- Volume
- Triangles
- Futures
- Cycles
- Volatility
- ZIGZAG
- MESA
- Retracement
- Aroon
INDICATORS LIST
LIST OF TOPICS
PRINT THIS ARTICLE
by Donald W. Pendergast, Jr.
Shares of Caterpillar Inc. are up about 6% after making a major multicycle swing low in mid-July 2012. Is there more of a rally in store?
Position: N/A
Donald W. Pendergast, Jr.
Donald W. Pendergast is a financial markets consultant who offers specialized services to stock brokers and high net worth individuals who seek a better bottom line for their portfolios.
PRINT THIS ARTICLE
CYCLES
More Rebound Ahead For CAT?
08/08/12 10:24:20 AMby Donald W. Pendergast, Jr.
Shares of Caterpillar Inc. are up about 6% after making a major multicycle swing low in mid-July 2012. Is there more of a rally in store?
Position: N/A
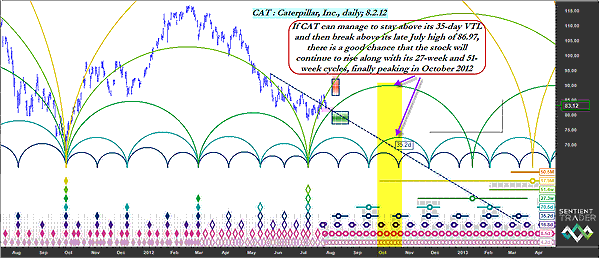
| For swing traders who love to capitalize on the powerful moves that some large-cap company stocks can make, few stocks are more beloved than Caterpillar, Inc. (CAT). Since bottoming with the rest of the broad market on October 4, 2011, the stock made a run from $67.54 to $116.95 (peaking on February 24, 2012) and then plummeted all the way down to $78.25. It closed August 2, Thursday's trading session at $83.12 and, based on its dominant price cycles, may already be headed to significantly higher prices by sometime in October 2012. Here's a closer look at CAT's daily cycles chart now (Figures 1 and 2). |

|
| FIGURE 1: CAT, DAILY. When seven or more price cycles bottom in CAT, the odds favor a subsequent period of steadily upward price action. Currently, CAT is not expected to peak out until sometime in October 2012; expect a modest correction then, followed by another, minor push higher into year-end. |
| Graphic provided by: Sentient Trader. |
| |
| According to the latest price cycle analysis for CAT, the stock made a major multicycle low on July 12, 2012, after enduring a major, four and a half month decline and has since begun to rally, albeit in a series of short starts and stops, grinding about 6% higher since then. The stock is actually perched just on top of its descending 35-day valid trendline (VTL), and if it can manage to stay on the north side of this key cyclical confirmation indicator and soon take out its July 30, 2012, swing high of $86.97, the stock has a high probability of being pulled significantly higher by its sharply rising 27-week and 51-week price cycles (the two large semi-circles on the chart) with an anticipated multicycle high being completed sometime during the month of October 2012. See the vertical yellow shaded box on the chart for the approximate dates to expect CAT to make its first major set of cycle highs coming out of the July 2012 hole. Medium-term money flow (not shown) in CAT is modestly bullish, with a positive price/money flow divergence already having been resolved by the rise in price since mid-July. Long-term money flow is still negative, however, and needs more time to play catch-up after such a major selloff in CAT earlier this year. With the price cycles in the .OEX still pointing toward more gains through August 2012, traders and investors in CAT are well-positioned as all of these powerfully bullish price cycles bulldoze their way upward, very likely pulling CAT up ("Honey, just look at the CAT the price cycles dragged in tonight!") toward higher valuations for the next eight to 10 weeks. |

|
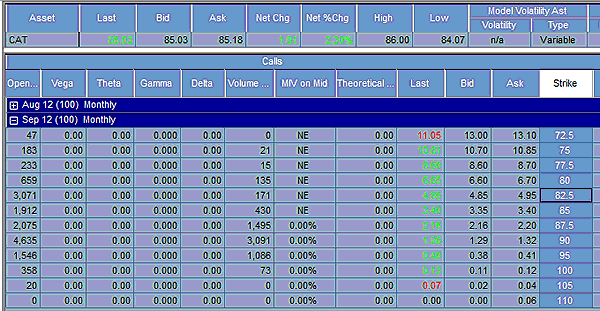
| FIGURE 2: COVERED CALLS. The September $82.50 calls look attractive now, especially for traders considering a near term covered call play in this high-beta, large-cap stock. |
| Graphic provided by: TradeStation. |
| |
| Covered calls look like an excellent way to play CAT's recent bullish turn and anticipated cyclical strength; the September $82.50 calls are selling for $4.85 and feature an excellent bid-ask spread and high open interest volume of 3,071 contracts. These calls are in the money already, and the big idea is to simply put this entire buy-write trade on at a price of $80.25 or less and then hold it through September option expiration on September 21, 2012. The annualized return for this trade is about 18%, which is about 18 times as much as you would get from your local bank on a one-year CD, for your information; of course, you'll only realize that rate of return if CAT remains above $82.50 at expiration. It would be wise to start this trade off with an initial stop of $82.00 and then switch over to a 21-day exponential moving average (EMA) as your stop if and when CAT starts to climb again. A daily close beneath either of these price levels before September option expiration is your signal to simply close out the entire trade and wait for another attractive setup. Overall, this looks like a very low-risk, high-probability covered-call setup, one that should be traded with no more than 1% to 2% risk of your equities margin account. |
Donald W. Pendergast is a financial markets consultant who offers specialized services to stock brokers and high net worth individuals who seek a better bottom line for their portfolios.
| Title: | Writer, market consultant |
| Company: | Linear Trading Systems LLC |
| Jacksonville, FL 32217 | |
| Phone # for sales: | 904-239-9564 |
| E-mail address: | lineartradingsys@gmail.com |
Traders' Resource Links | |
| Linear Trading Systems LLC has not added any product or service information to TRADERS' RESOURCE. | |
Click here for more information about our publications!
Comments

|

Request Information From Our Sponsors
- StockCharts.com, Inc.
- Candle Patterns
- Candlestick Charting Explained
- Intermarket Technical Analysis
- John Murphy on Chart Analysis
- John Murphy's Chart Pattern Recognition
- John Murphy's Market Message
- MurphyExplainsMarketAnalysis-Intermarket Analysis
- MurphyExplainsMarketAnalysis-Visual Analysis
- StockCharts.com
- Technical Analysis of the Financial Markets
- The Visual Investor
- VectorVest, Inc.
- Executive Premier Workshop
- One-Day Options Course
- OptionsPro
- Retirement Income Workshop
- Sure-Fire Trading Systems (VectorVest, Inc.)
- Trading as a Business Workshop
- VectorVest 7 EOD
- VectorVest 7 RealTime/IntraDay
- VectorVest AutoTester
- VectorVest Educational Services
- VectorVest OnLine
- VectorVest Options Analyzer
- VectorVest ProGraphics v6.0
- VectorVest ProTrader 7
- VectorVest RealTime Derby Tool
- VectorVest Simulator
- VectorVest Variator
- VectorVest Watchdog
