HOT TOPICS LIST
- MACD
- Fibonacci
- RSI
- Gann
- ADXR
- Stochastics
- Volume
- Triangles
- Futures
- Cycles
- Volatility
- ZIGZAG
- MESA
- Retracement
- Aroon
INDICATORS LIST
LIST OF TOPICS
PRINT THIS ARTICLE
by Donald W. Pendergast, Jr.
After experiencing a sizable decline in the first half of 2012, shares of Halliburton have made a major bullish turnaround.
Position: N/A
Donald W. Pendergast, Jr.
Donald W. Pendergast is a financial markets consultant who offers specialized services to stock brokers and high net worth individuals who seek a better bottom line for their portfolios.
PRINT THIS ARTICLE
MOMENTUM
HAL Leading Oil Services Pack
08/07/12 09:37:10 AMby Donald W. Pendergast, Jr.
After experiencing a sizable decline in the first half of 2012, shares of Halliburton have made a major bullish turnaround.
Position: N/A
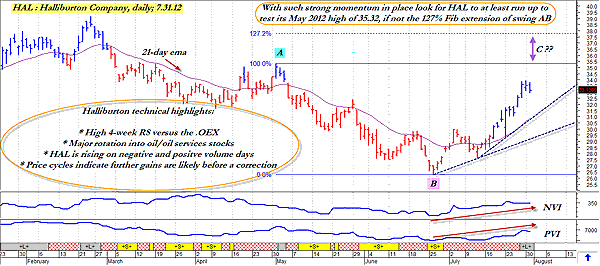
| The price of crude oil was over $100 per barrel during parts of March-April 2012 and gasoline prices were averaging around $4 per gallon; oil services stocks, however, were actually more than a month into a substantial decline, commencing after they peaked as a group on February 24, 2012. Halliburton (HAL), a key player in the oil services group, certainly saw its share price take a big hit, declining from $39.19 to $26.28 as of June 26, 2012. Now, the times they are a changin', and HAL shareholders and traders have a nice bullish reversal on their hands. here's a closer look now (Figures 1, 2, and 3). |

|
| FIGURE 1: HAL, DAILY. Although HAL could pull back at any time, its combination of healthy earnings, strong relative strength, and bullish volume indicators seem to suggest it may be easily able to run up to at least the lower resistance level (if not the higher one near $37.80) shown on the chart. |
| Graphic provided by: MetaStock. |
| Graphic provided by: CS Scientific expert from MetaStock 11. |
| |
| If you've traded and/or invested in stocks for any length of time, you know the feeling you get when you glance at a stock chart and see that the stock has been in a steady bear trend for three to six months -- or even more. The first thought you might have might be something like: 1. "This stock is a lost cause." 2. "No way this turkey can ever fly again." 3. "Maybe I should go short now -- the talking heads on Blab-berg and CN-Tee-Hee said that it's way below its 200-day moving average." 4. "Warren LunchLine from DustBowl Futures says crude oil will be at $48 by 2013. I better short Halliburton ASAP." No doubt, that's probably what any number of inexperienced, emotionally driven traders and investors might have said if they had checked HAL's daily chart a day before it bottomed on June 26, 2012. Of course, had they actually followed through with such faulty, short-sighted reasoning, they would have had their proverbial heads handed to them. So here are a few rules to keep in mind, especially if you are new to the trading investing game: 1. When you see that a large-cap stock has had an extended decline, resist the urge to jump on the short-selling bandwagon. 2. Look at such declines -- especially in stocks of well-run, dividend-paying companies with a substantial share of the market they do business in -- as an opportunity to add it to your watchlist of attractive reversal candidates. 3. To better identify upcoming bullish turns, check the money flow trend of such stocks for signs of accumulation and bullish price/money flow reversals. 4. Monitor the relative strength (RS) rankings of such stocks. If you had seen, for example, that HAL had suddenly dropped off of the list of worst-performing .OEX stocks and begun to appear on the list of best performing .OEX or .SPX stocks, then you have another confirmation of a bullish turn in process. 5. Finally, if the stock makes the grade on all of the above, wait for a solid mechanical buy signal before deciding to go long the stock. Note how the negative volume index (NVI) and positive volume index (PVI) were both flattening out as HAL made its final descent into swing low B. This was a warning that the worst part of the decline was likely nearing its end and that the stock was a good watchlist candidate. Okay -- let's see if we can figure out a way to play HAL in the here and now. |

|
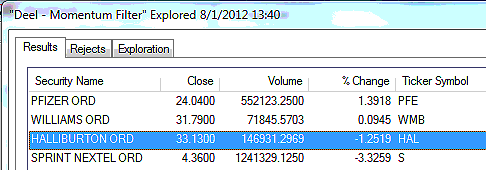
| FIGURE 2: LARGE-CAP STOCKS. The four large-cap stocks identified by the Deel momentum filter in MetaStock 11. |
| Graphic provided by: MetaStock. |
| Graphic provided by: MetaStock Explorer. |
| |
| HAL boasts one of the strongest four-week relative strength rankings versus the .OEX and .SPX and is also trending very nicely above its upsloping 21-day exponential moving average (EMA), and the real clincher here is the twin uptrends in both the NVI and PVI. If you've never used these volume-based indicators, I urge you to check them out as they do a great job of identifying trending moves and divergence setups. The NVI simply tells us the direction of the stock on days of declining volume and the PVI tells us the direction of the stock on days of increasing volume. When you see both indicators trending higher (lower) in the same direction as a stock, you know for sure that a very strong trend move is under way, and that's just what we see on HAL's daily chart. |

|
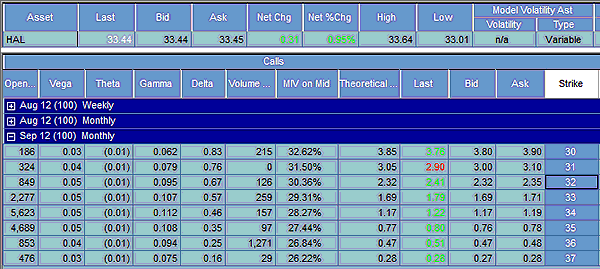
| FIGURE 3: OPTION CHAINS. Halliburton's September 2012 call option chains. Note the heavy open interest in the $34 calls; perhaps the smart money is confident in further gains in this oil services giant? |
| Graphic provided by: TradeStation. |
| |
| When a strong relative strength (RS) large cap is trending higher, one of the most conservative trading moves to make is to put on a covered-call trade, one with a near-term call option expiration. With HAL's price cycles expected to draw the stock up to at least a price equal to point A ($35.32), if not the Fibonacci 127.2% level at $37.80 before correcting, putting on a September '12 $32.00 covered call seems to make a lot of sense here. The calls have a delta of 0.67 and daily time decay of about $1 per day at present; the bid-ask spread is excellent and the open interest figure is nearly 900 contracts. If you put this trade on, pay no more than $31.15 and then use the stock's 21-day EMA (currently near $30.90) as your trailing stop for the entire position. A daily close by HAL below the EMA tells you it's time to close down the entire trade, no questions asked. While no one knows how this hypothetical trade will turn out, it does appear to be a low-risk, moderate-reward trade setup; just be sure to limit your maximum account risk to no more than 1% to 2%, no matter how bullish you may be on HAL at the moment. |
Donald W. Pendergast is a financial markets consultant who offers specialized services to stock brokers and high net worth individuals who seek a better bottom line for their portfolios.
| Title: | Writer, market consultant |
| Company: | Linear Trading Systems LLC |
| Jacksonville, FL 32217 | |
| Phone # for sales: | 904-239-9564 |
| E-mail address: | lineartradingsys@gmail.com |
Traders' Resource Links | |
| Linear Trading Systems LLC has not added any product or service information to TRADERS' RESOURCE. | |
Click here for more information about our publications!
PRINT THIS ARTICLE

Request Information From Our Sponsors
- VectorVest, Inc.
- Executive Premier Workshop
- One-Day Options Course
- OptionsPro
- Retirement Income Workshop
- Sure-Fire Trading Systems (VectorVest, Inc.)
- Trading as a Business Workshop
- VectorVest 7 EOD
- VectorVest 7 RealTime/IntraDay
- VectorVest AutoTester
- VectorVest Educational Services
- VectorVest OnLine
- VectorVest Options Analyzer
- VectorVest ProGraphics v6.0
- VectorVest ProTrader 7
- VectorVest RealTime Derby Tool
- VectorVest Simulator
- VectorVest Variator
- VectorVest Watchdog
- StockCharts.com, Inc.
- Candle Patterns
- Candlestick Charting Explained
- Intermarket Technical Analysis
- John Murphy on Chart Analysis
- John Murphy's Chart Pattern Recognition
- John Murphy's Market Message
- MurphyExplainsMarketAnalysis-Intermarket Analysis
- MurphyExplainsMarketAnalysis-Visual Analysis
- StockCharts.com
- Technical Analysis of the Financial Markets
- The Visual Investor
