HOT TOPICS LIST
- MACD
- Fibonacci
- RSI
- Gann
- ADXR
- Stochastics
- Volume
- Triangles
- Futures
- Cycles
- Volatility
- ZIGZAG
- MESA
- Retracement
- Aroon
INDICATORS LIST
LIST OF TOPICS
PRINT THIS ARTICLE
by Gary Grosschadl
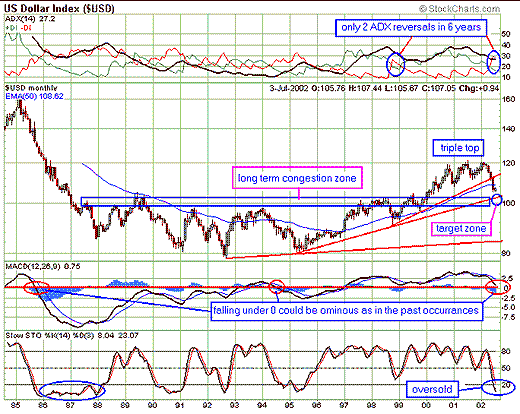
The long-term triple top has brought the USD down rather dramatically in the form of a bearish three black crows candlestick formation as shown on this monthly chart.
Position: N/A
Gary Grosschadl
Independent Canadian equities trader and technical analyst based in Peterborough
Ontario, Canada.
PRINT THIS ARTICLE
CHART ANALYSIS
The US Dollar Chart Shows More Downside Coming
07/05/02 01:30:58 PMby Gary Grosschadl
The long-term triple top has brought the USD down rather dramatically in the form of a bearish three black crows candlestick formation as shown on this monthly chart.
Position: N/A
| It seems that many traders feel that the USD has bottomed out, signaling a possible rally for the main indices and a corresponding decline for golds. However looking at this chart, you could surmise the opposite as the USD can easily move down to the long-term congestion zone between 100 - 104 as illustrated. |
| This monthly chart does show a significant trend change. A three-year lower trendline has been shattered. In doing so the ADX (average directional movement indicator) has gone through a bearish reversal - only the second one in six years. This reversal looks more serious than the one six years ago as the 50-day EMA has been convincingly violated to the downside. |

|
| Graphic provided by: stockcharts.com. |
| |
| The stochastics indicator shows an oversold condition which may lead to a weak rally before the decline resumes. It is interesting to note, looking back to the period 1986 - 1988, stochastics stayed oversold for a long period of time when ADX had a bearish reversal and stayed that way for several years. This is not to suggest that this will happen again but only a reminder that it can. |
| The MACD (moving average convergence/divergence) indicator also suggests the possibility of a dire cycle repeating. This indicator is perilously close to a bearish move below the zero line. This would only be the third time in the past 17 years if it follows through. Note the sizable declines that followed. |
| If this bearish view of the USD holds true then it also makes sense that the main indices still have more downside ahead and that correspondingly the gold sector will have another upleg in store. In previous articles I have said a move to $350 gold would not surprise me as the main indices dip lower once again. |
Independent Canadian equities trader and technical analyst based in Peterborough
Ontario, Canada.
| Website: | www.whatsonsale.ca/financial.html |
| E-mail address: | gwg7@sympatico.ca |
Click here for more information about our publications!
Comments
Date: 07/08/02Rank: 5Comment:
Date: 07/13/02Rank: Comment: Sir do u think that dollar chart will violate its long term congestion zone in the coming months.
Date: 07/13/02Rank: Comment: Sir do u think that dollar chart will violate its long term congestion zone in the coming months. DO U THINK THAT DOLLAR CHART IS FORMING THE PATTERN OF ROUNDING BOTTOM.

Request Information From Our Sponsors
- StockCharts.com, Inc.
- Candle Patterns
- Candlestick Charting Explained
- Intermarket Technical Analysis
- John Murphy on Chart Analysis
- John Murphy's Chart Pattern Recognition
- John Murphy's Market Message
- MurphyExplainsMarketAnalysis-Intermarket Analysis
- MurphyExplainsMarketAnalysis-Visual Analysis
- StockCharts.com
- Technical Analysis of the Financial Markets
- The Visual Investor
- VectorVest, Inc.
- Executive Premier Workshop
- One-Day Options Course
- OptionsPro
- Retirement Income Workshop
- Sure-Fire Trading Systems (VectorVest, Inc.)
- Trading as a Business Workshop
- VectorVest 7 EOD
- VectorVest 7 RealTime/IntraDay
- VectorVest AutoTester
- VectorVest Educational Services
- VectorVest OnLine
- VectorVest Options Analyzer
- VectorVest ProGraphics v6.0
- VectorVest ProTrader 7
- VectorVest RealTime Derby Tool
- VectorVest Simulator
- VectorVest Variator
- VectorVest Watchdog
