HOT TOPICS LIST
- MACD
- Fibonacci
- RSI
- Gann
- ADXR
- Stochastics
- Volume
- Triangles
- Futures
- Cycles
- Volatility
- ZIGZAG
- MESA
- Retracement
- Aroon
INDICATORS LIST
LIST OF TOPICS
PRINT THIS ARTICLE
by Koos van der Merwe
Trying to find market direction by looking at today's indexes is not easy.
Position: Accumulate
Koos van der Merwe
Has been a technical analyst since 1969, and has worked as a futures and options trader with First Financial Futures in Johannesburg, South Africa.
PRINT THIS ARTICLE
ELLIOTT WAVE
Is The NASDAQ Calling The Way?
08/02/12 10:15:00 AMby Koos van der Merwe
Trying to find market direction by looking at today's indexes is not easy.
Position: Accumulate
| Are the banks starting to find a solution to their problems? The past week saw former Citigroup CEO Sanford Weill say that banks should be broken up to protect taxpayers. He told CNBC that what "we should probably do is go and split up investment banking from banking and have banks be deposit takers, have banks make commercial and real estate loans." He added that big banks should be broken up so that the "taxpayers will never be at risk, so that the depositors won't be at risk," adding that in such a system, bank leverage will be "something reasonable." This is basically what the Dodd-Frank Act will attempt to do. The Volcker rule is a specific section of the Dodd-Frank Act originally proposed by American economist and former US Federal Reserve chairman Paul Volcker to restrict US banks from making certain kinds of speculative investments that do not benefit their customers. Volcker argued that such speculative activity played a key role in the financial crisis of 2007-2010. With the US Presidential election due in November, political fighting has appeared to place politics ahead of common sense. However, one index of sanity in these uncertain times appears to be the NASDAQ. |

|
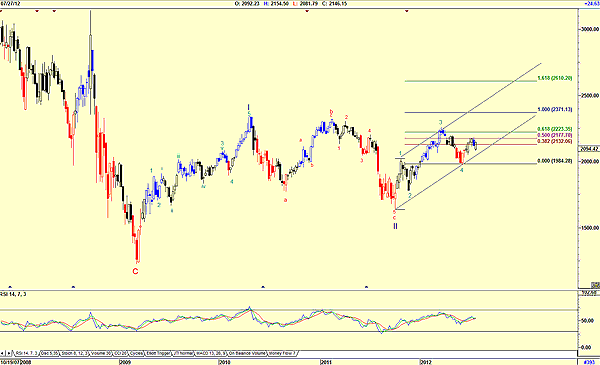
| FIGURE 1: NASDAQ, WEEKLY |
| Graphic provided by: AdvancedGET. |
| |
| Figure 1 is a weekly chart of the NASDAQ Financial Index (IXF). The chart is showing that the index has completed a complicated wave II and is now in a wave 5 of wave III with a target of 2371.13 or 2610.20. The chart obeys the first rule of Elliott wave, namely that the wave count must look correct, and this wave count does look correct. The relative strength index (RSI) is suggesting a bull trend and a rise to these levels. |

|
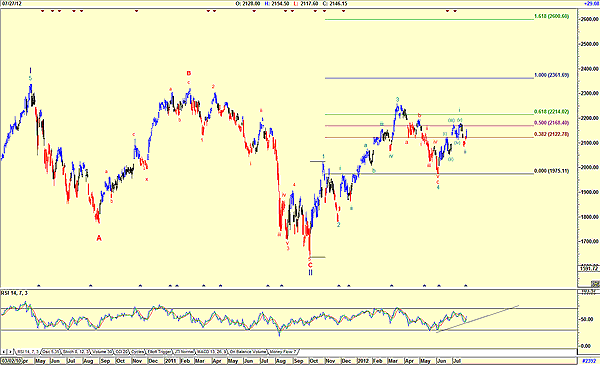
| FIGURE 2: NASDAQ, DAILY |
| Graphic provided by: AdvancedGET. |
| |
| The daily chart in Figure 2 is confirming a rise into wave 5 of wave III with a target for wave III of 2361.69 (1% of wave 1 of wave III) or 2600.50 (1.618% of wave 1 of wave III). The RSI is confirming a bull trend. The NASDAQ is suggesting that the US banks are solving their problems and investors are buying the banks in anticipation of a rise. Whether this is because the Dodd-Frank bill will be passed by Congress or whether the banks, feeling the guilt of their greed, are cleaning up their own mess, is anyone's guess. I would be a buyer for a long-term hold of selective banks. |
Has been a technical analyst since 1969, and has worked as a futures and options trader with First Financial Futures in Johannesburg, South Africa.
| Address: | 3256 West 24th Ave |
| Vancouver, BC | |
| Phone # for sales: | 6042634214 |
| E-mail address: | petroosp@gmail.com |
Click here for more information about our publications!
PRINT THIS ARTICLE

Request Information From Our Sponsors
- StockCharts.com, Inc.
- Candle Patterns
- Candlestick Charting Explained
- Intermarket Technical Analysis
- John Murphy on Chart Analysis
- John Murphy's Chart Pattern Recognition
- John Murphy's Market Message
- MurphyExplainsMarketAnalysis-Intermarket Analysis
- MurphyExplainsMarketAnalysis-Visual Analysis
- StockCharts.com
- Technical Analysis of the Financial Markets
- The Visual Investor
- VectorVest, Inc.
- Executive Premier Workshop
- One-Day Options Course
- OptionsPro
- Retirement Income Workshop
- Sure-Fire Trading Systems (VectorVest, Inc.)
- Trading as a Business Workshop
- VectorVest 7 EOD
- VectorVest 7 RealTime/IntraDay
- VectorVest AutoTester
- VectorVest Educational Services
- VectorVest OnLine
- VectorVest Options Analyzer
- VectorVest ProGraphics v6.0
- VectorVest ProTrader 7
- VectorVest RealTime Derby Tool
- VectorVest Simulator
- VectorVest Variator
- VectorVest Watchdog
