

HOT TOPICS LIST
- MACD
- Fibonacci
- RSI
- Gann
- ADXR
- Stochastics
- Volume
- Triangles
- Futures
- Cycles
- Volatility
- ZIGZAG
- MESA
- Retracement
- Aroon
INDICATORS LIST
LIST OF TOPICS
PRINT THIS ARTICLE
by Bruce Tintelnot
When trading trends, it's common wisdom that "the trend is your friend." Recognizing trends as early as possible is the key to finding these "friends" for larger profits. The average directional movement index (ADX) can be an excellent tool for gauging trend strength as well as for generating good entry and exit signals.
Position: N/A
Bruce Tintelnot
Bruce Tintelnot is a freelance writer and researcher in the areas of investments and economics. He has a bachelor's degree in business administration with a financial major and successful online trading experience.
PRINT THIS ARTICLE
AVE DIREC MOVE
Using The ADX For Determining Trends
08/19/12 11:43:09 AMby Bruce Tintelnot
When trading trends, it's common wisdom that "the trend is your friend." Recognizing trends as early as possible is the key to finding these "friends" for larger profits. The average directional movement index (ADX) can be an excellent tool for gauging trend strength as well as for generating good entry and exit signals.
Position: N/A
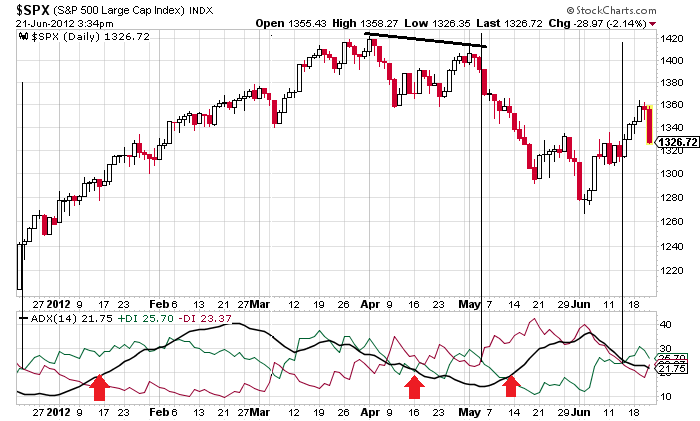
| The average directional movement index is a trading technique developed by J. Welles Wilder Jr. in the 1970s that measures a trend's strength (momentum) and direction. It moves horizontally and consists of an ADX (indicator) line that is derived from the moving averages of the positive directional index (+DI) and the negative directional index (-DI) of the directional movement indicator (DMI). Often these indicators are superimposed to form the ADX, sometimes designated as ADX/DMI, but they can also be presented separately. ADX The ADX is a trend strength indicator that was that originally designed for commodities and currencies but can be used on stocks and indexes with similar volatilities. It is drawn as a single line on the chart and is derived from a moving average of two lines, the +DI and -DI, that make up another indicator called the directional movement indicator (DMI). The DMI is usually based on a 14-bar period. The ADX measures trend strength based on a range of zero to 100, regardless of the direction of the trend. The closer the ADX gets to 100, the stronger the trend. A falling ADX does not necessarily mean that a trend is ending; it simply indicates that a trend is weakening and is not in a reversal. It also does not coincide with rising or falling prices; it only measures the strength of a trend. The daily chart of the S&P 500 in Figure 1 shows how the ADX can be applied. Following is a general guideline for reading ADX values: 0 to 20: Prices are ranging and not trending. 20 to 25: A weak indication that a trend might be developing. Above 25: Suggests a strong trend gaining strength. Above 40: A very strong, or steep, trend. This tends to precede reversals. Above 50: Extremely strong trend. |
|
| FIGURE 1: S&P 500 AND ADX. This shows a candlestick chart of the S&P 500 from the end of December 2011 to the middle of June 2012. The vertical columns indicate where a trend can be considered reversing. During the upward trend, the ADX peaked at 40 and began to decline, but the trend wasn�t over until it moved below 20, coinciding with a double top reversal chart pattern. |
| Graphic provided by: StockCharts.com. |
| |
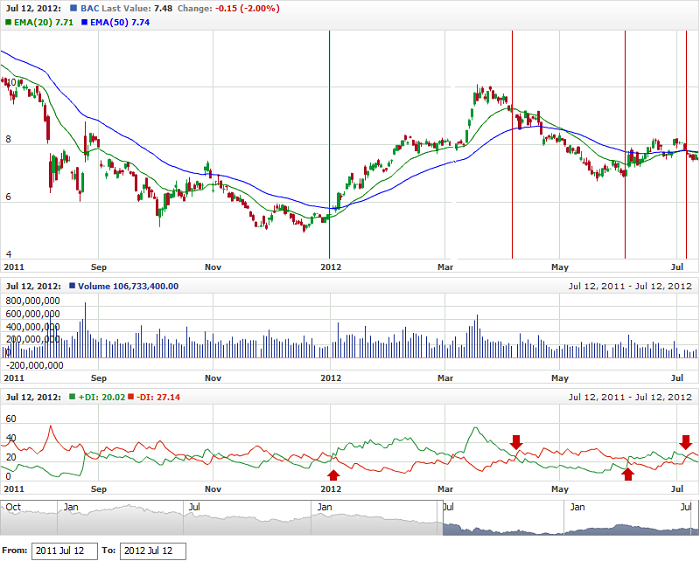
| DMI The directional movement indicator (DMI) measures the direction of a trend using the +DI line (usually green) and the -DI line (usually red) to indicate the direction of trends (Figure 2). They move horizontally on a chart opposite to each other in an almost mirror-like fashion. When the +DI is above the -DI, prices are moving upward in what is deemed positive movement. The reverse is true for downward moving prices and negative movement. The values for the calculations are determined by: Positive movement = (Current high - Prior high) > (Prior low - Current low) What is considered positive directional movement (+DM) is a current high minus a prior high, provided it is positive. Any negative values are considered to be zero. Negative movement = (Prior low - Current low) > (Current high - Prior high) What is considered negative directional movement (-DM) is a prior low minus a current low, provided it is positive. A negative value would be entered as zero. |
|
| FIGURE 2: BAC AND DMI. This chart displays the price changes for Bank of America (BAC) from August 2011 to July 2012. The DMI below the price chart shows that the downward trend during 2011 was a volatile one with many crossovers, but generally, the �DI stayed above the +DI. The trend ended in 2012 with the +DI crossing upward above the �DI, which actually preceded the crossover of the 20-day and 50-day exponential moving averages (EMA). The new upward trend reverses around mid-April, indicated on the DMI by a crossover of the �DI above the +DI, again preceding the EMA crossover. Another upward movement is shown in June 2012 but cannot be deemed with confidence a new trend or just a retracement. Using the ADX and other indicators would be useful here for confirmation. In general, the DMI crossovers closely coincided with the share prices when they crossed over the 20-day EMA. |
| Graphic provided by: Quote.com. |
| |
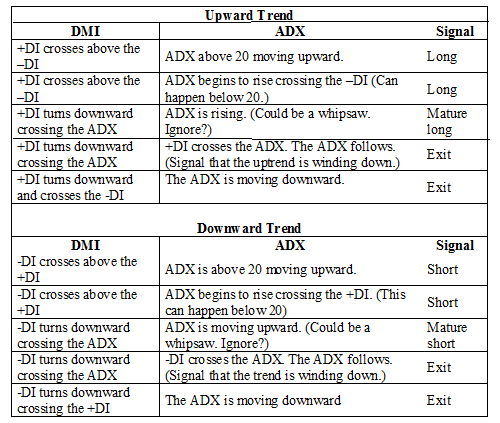
| Calculations The calculations for the ADX are complex and beyond the scope of this article. Suffice it to say that the ADX is derived from the DMI and the smoothing involved in these calculations is what causes the significant lag time of the ADX. Signals The ADX generates some fairly reliable signals, especially when used with another trend indicator like moving averages. It can catch trends at the time they begin but, as with other indicators, this is impossible to recognize with confidence until they develop further. Wilder considered a trend to be developing when the ADX was at 25, but many analysts use 20. As already shown, signals for the ADX are indicated by crossovers of the +DI, the -DI, and the ADX. The following table shows some commonly suggested signals for this indicator: |
|
| |
| When the +DI and the -DI are constantly crossing over each other -- almost looking like a DNA molecule -- there is no trend; the market is ranging and other indicators such as the stochastic, parabolic SAR, or Bollinger bands should be used for generating buy and sell signals. The ADX helps traders determine when a trend is strong so they can let their trades run. It also shows when a trend is beginning to show weakness and is ranging. It can generate signals that help traders determine when to enter or exit trades during a trend. Often, the signals seem early but play out to be safe when the chart starts ranging between trend reversals. Sometimes the signals break even. As usual when trading, it would be prudent to use other indicators to confirm each signal before making the decision to buy or sell. Resources IncredibleCharts.com [2012]. "Directional Movement v. Weinstein." StockCharts.com [2012]. "Average Directional Index." |
| Disclaimer: There always risks associated with investing in capital markets. How much can be lost in a worse case investing scenario depends on the particular market, the judgment of individual investors and money management. This article is not intended to be considered a complete discussion of this topic or a general recommendation when to buy or sell. |
Bruce Tintelnot is a freelance writer and researcher in the areas of investments and economics. He has a bachelor's degree in business administration with a financial major and successful online trading experience.
Click here for more information about our publications!
Comments
Date:�08/19/12Rank:�5Comment:�I liked the indepth analysis of this indicator--it has always puzzzled me but now I will utilize it more ofter.
Thanks
Lynn Bendz
Date:�08/22/12Rank:�5Comment:�When the ADX gets below 20, and particularly below 15, the breakout move (when it comes) tends to be strong. This very low ADX is one of the components of my Stochastic Pop (Popsteckle) methodology, written up in the August 2000 issue of TASC.
I enjoyed your article.
Dave Steckler

Request Information From Our Sponsors
- StockCharts.com, Inc.
- Candle Patterns
- Candlestick Charting Explained
- Intermarket Technical Analysis
- John Murphy on Chart Analysis
- John Murphy's Chart Pattern Recognition
- John Murphy's Market Message
- MurphyExplainsMarketAnalysis-Intermarket Analysis
- MurphyExplainsMarketAnalysis-Visual Analysis
- StockCharts.com
- Technical Analysis of the Financial Markets
- The Visual Investor
- VectorVest, Inc.
- Executive Premier Workshop
- One-Day Options Course
- OptionsPro
- Retirement Income Workshop
- Sure-Fire Trading Systems (VectorVest, Inc.)
- Trading as a Business Workshop
- VectorVest 7 EOD
- VectorVest 7 RealTime/IntraDay
- VectorVest AutoTester
- VectorVest Educational Services
- VectorVest OnLine
- VectorVest Options Analyzer
- VectorVest ProGraphics v6.0
- VectorVest ProTrader 7
- VectorVest RealTime Derby Tool
- VectorVest Simulator
- VectorVest Variator
- VectorVest Watchdog