HOT TOPICS LIST
- MACD
- Fibonacci
- RSI
- Gann
- ADXR
- Stochastics
- Volume
- Triangles
- Futures
- Cycles
- Volatility
- ZIGZAG
- MESA
- Retracement
- Aroon
INDICATORS LIST
LIST OF TOPICS
PRINT THIS ARTICLE
by David Penn
Down as much as 90% in the wake of the emerging markets fallout, countries like Indonesia, Malaysia and the Philippines look ready to rebound.
Position: N/A
David Penn
Technical Writer for Technical Analysis of STOCKS & COMMODITIES magazine, Working-Money.com, and Traders.com Advantage.
PRINT THIS ARTICLE
HEAD & SHOULDERS
First Philippine's Head and Shoulders Bottom
07/05/02 09:31:01 AMby David Penn
Down as much as 90% in the wake of the emerging markets fallout, countries like Indonesia, Malaysia and the Philippines look ready to rebound.
Position: N/A
| As effective as technical analysis is when deployed against small, intraday time frames, there is an argument that technical analysis is equally valuable when used to understand long-term price action, as well. In this way, technical analysis really is like quantum physics, which seems to explain best the behavior of both the most elementary particles as well as the largest structures in the known universe. |
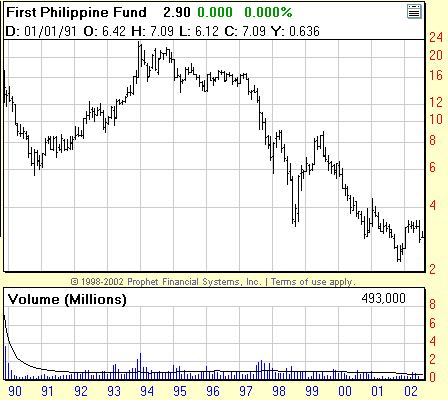
| The time frame under consideration here is about ten years. And the subject is neither elementary particles nor supernovas, but the depressed equity shares of companies in emerging markets. How depressed? Looking at a variety of closed-end funds that invest solely in Asian emerging markets, we find the Singapore Fund (SGF) down 83% from its all-time high, the Malaysian Fund (MF) down 88% from its all-time high, and the First Philippine Fund (FPF) down 90% from its all-time high. Appropriately enough, all of the above all-time highs were reached in the emerging markets' euphoria of the early 1990s that ended abruptly in 1994. The question now is whether these beaten down funds, essentially, have been beaten down enough. |

|
| Figure 1: A ten-year look at the First Philippine Fund. |
| Graphic provided by: Prophet Financial Systems, Inc.. |
| |
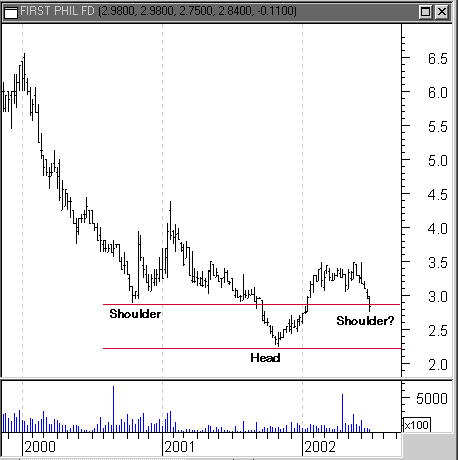
| Some promising signs are appearing in the First Philippine Fund. FPF appeared to make a correction low in 1998 at about 3.5. Unfortunately for FPF, the subsequent rally -- during which FPF reached a high of about 9 -- turned out to be a bear market rally instead of the resumption of a new bull market in Philippine equities. As such, FPF began to slide in mid-1999, losing 72% as it reached a final bottom of about 2.5 late in 2001. But the combination of this final bottom (as it appears) and the immediately previous correction low in 2000 appears to have set up the final, right side shoulder of a head and shoulders bottom formation. The potential H&S bottom is not perfectly formed, but the shallow trough followed by a deeper trough followed by a shallow trough pattern is clear -- or will prove clear if prices rally from current levels around 2.9 without too much more in the way of additional declines (a close beneath the low of 2.2 would more or less invalidate the formation). |
 Figure 2: One shoulder more and this head and shoulders bottom should be complete. If the head and shoulders bottom asserts itself, then what kind of upside might be expected? The formation size is about 1.75: the formation low of 2.25 subtracted from the value at the formation top (or neckline; a downwardly sloping neckline in this instance) which is about 4. This provides for a minimum upside target of between 5.75 and 6. This level, interestingly enough, would reflect a test of the highs of 2000, and set up a run on the 1999 highs of about 9. Besting the 1999 highs, which mark the rally peak in the previous, 1994-2001 bear market, would also signify the end of the bear market for FPF from a Dow theory perspective. |
| It should be repeated that FPF is a closed-end fund, which some traders and investors are reluctant to purchase. Two points on that note are in order: first, good, accurate information on closed-end funds (CEFs) abounds in both books and on the Internet, so those unfamiliar with these funds can in fact educate themselves. The second point is that, while FPF is not a proxy for the entire Asian emerging markets group (which includes Malaysia, Thailand and Indonesia, but tends to exclude Japan, South Korea and Taiwan), it does have many of the same characteristics of closed-end funds from these other countries in terms of its price history since the collapse of the emerging markets stocks in 1994. Those who require greater liquidity than FPF can provide may consider other vehicles (such as the Singapore ishare) that have been trading similarly to the rest of the emerging markets group. |
Technical Writer for Technical Analysis of STOCKS & COMMODITIES magazine, Working-Money.com, and Traders.com Advantage.
| Title: | Technical Writer |
| Company: | Technical Analysis, Inc. |
| Address: | 4757 California Avenue SW |
| Seattle, WA 98116 | |
| Phone # for sales: | 206 938 0570 |
| Fax: | 206 938 1307 |
| Website: | www.Traders.com |
| E-mail address: | DPenn@traders.com |
Traders' Resource Links | |
| Charting the Stock Market: The Wyckoff Method -- Books | |
| Working-Money.com -- Online Trading Services | |
| Traders.com Advantage -- Online Trading Services | |
| Technical Analysis of Stocks & Commodities -- Publications and Newsletters | |
| Working Money, at Working-Money.com -- Publications and Newsletters | |
| Traders.com Advantage -- Publications and Newsletters | |
| Professional Traders Starter Kit -- Software | |
Click here for more information about our publications!
PRINT THIS ARTICLE

|

Request Information From Our Sponsors
- StockCharts.com, Inc.
- Candle Patterns
- Candlestick Charting Explained
- Intermarket Technical Analysis
- John Murphy on Chart Analysis
- John Murphy's Chart Pattern Recognition
- John Murphy's Market Message
- MurphyExplainsMarketAnalysis-Intermarket Analysis
- MurphyExplainsMarketAnalysis-Visual Analysis
- StockCharts.com
- Technical Analysis of the Financial Markets
- The Visual Investor
- VectorVest, Inc.
- Executive Premier Workshop
- One-Day Options Course
- OptionsPro
- Retirement Income Workshop
- Sure-Fire Trading Systems (VectorVest, Inc.)
- Trading as a Business Workshop
- VectorVest 7 EOD
- VectorVest 7 RealTime/IntraDay
- VectorVest AutoTester
- VectorVest Educational Services
- VectorVest OnLine
- VectorVest Options Analyzer
- VectorVest ProGraphics v6.0
- VectorVest ProTrader 7
- VectorVest RealTime Derby Tool
- VectorVest Simulator
- VectorVest Variator
- VectorVest Watchdog
