HOT TOPICS LIST
- MACD
- Fibonacci
- RSI
- Gann
- ADXR
- Stochastics
- Volume
- Triangles
- Futures
- Cycles
- Volatility
- ZIGZAG
- MESA
- Retracement
- Aroon
INDICATORS LIST
LIST OF TOPICS
PRINT THIS ARTICLE
by Donald W. Pendergast, Jr.
Despite having suffered a sudden pullback in April 2012, shares of Fidelity Select Biotechnology have gone on to make new highs.
Position: N/A
Donald W. Pendergast, Jr.
Donald W. Pendergast is a financial markets consultant who offers specialized services to stock brokers and high net worth individuals who seek a better bottom line for their portfolios.
PRINT THIS ARTICLE
REL. STR COMPARATIVE
FBIOX Leading The Market Higher
07/31/12 08:11:44 AMby Donald W. Pendergast, Jr.
Despite having suffered a sudden pullback in April 2012, shares of Fidelity Select Biotechnology have gone on to make new highs.
Position: N/A
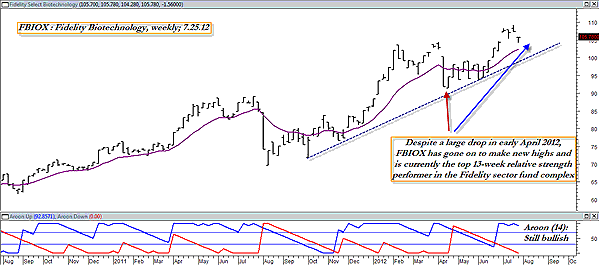
| For longer-term investors and traders, a great way to monitor the leading and lagging sectors and industry groups in the US stock market is to track the performance of the Fidelity Select Sector mutual funds. While some long-term market timers use a 40-, 48-, or even 52-week relative strength ranking system to directly trade the Select Sector funds, you can also elect to use the much shorter 13-week (one calendar quarter) method to determine which of these funds are strong or weak and then actually determine which of the stocks within the fund are the strongest. Using this method, you can then do some homework of your own and analyze the individual stocks for attractive chart patterns, earnings growth potential, and mechanical buy/sell signals. Here's a look at the weekly chart of the strongest 13-week performer in the Select Sector universe -- Fidelity Select Biotechnology (FBIOX). |

|
| FIGURE 1: FBIOX, WEEKLY. FBIOX has to top 13-week relative strength among all of the Fidelity Select Sector funds; its 14-week Aroon indicator still shows real bullish strength. |
| Graphic provided by: MetaStock. |
| Graphic provided by: MetaStock Explorer. |
| |
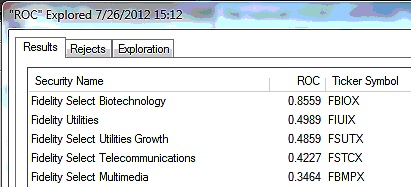
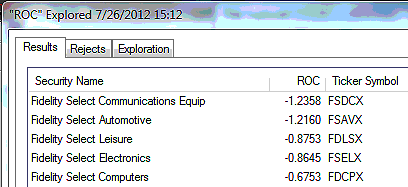
| FBIOX is the undisputed leading in terms of 13-week relative strength (vs. the .OEX), rising at a rate that is nearly double that of the second ranked fund, Fidelity Utilities (FIUIX). As we glance at the weekly chart of FBIOX (Figure 1), we see that even though it suffered a fairly large pullback in early April 2012, it has managed to go on to new highs and is leading the Select Sector pack in relative strength. See Figure 2. Its 14-week Aroon (14) trend intensity indicator is still in decidedly bullish territory and a solid long-term uptrend line is also in place. The stock is also above its rising 13-week exponential moving average (EMA), yet another sign of intermediate-term strength. While some traders/investors would be happy to just trade FBIOX (as a mutual fund it is a long-only instrument; you can't short FBIOX or the other Select Sector funds) as is, other traders might want to actually do some research on the stocks that Fidelity lists as being components of this fund, and then decide to trade them instead of the fund, especially since they would have more ways to trade them, including the use of puts and calls, trading from the short side, and so on. See Figure 3. |

|
| FIGURE 2: TOP FIVE SELECT SECTOR FUNDS. The top five Select Sector funds, ranked according to their relative strength vs. the .OEX over the past calendar quarter. |
| Graphic provided by: MetaStock. |
| Graphic provided by: MetaStock Explorer. |
| |
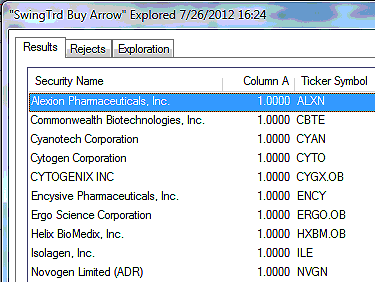
| According to the Fidelity website, the current top 10 holdings (as of May 30, 2012) for this fund include the following stocks: GILD, BIIB, VRTX, CELG, REGN, AMGN, ALXN, MDVN, BRMN, AMLN Running a 13-week relative strength ranking of these 10 stocks reveals that AMLN, VRTX, ALXN, and BRMN are all the top relative strength performers in this group. Now we can put these four stocks on our watchlist and wait for mechanical buy signals to see if any of these stocks will be going long in the next few trading sessions. In the meantime, we can also do some fundamental/technical research to determine which of these four stocks has: 1. The best swing trading potential 2. The best bid-ask spread in their option chains 3. The most attractive chart patterns, such as double/triple top buy signals, and consolidation breakouts 4. The best earnings growth potential -- a major factor to consider that many technical traders may be overlooking If you follow this very simple, potentially effective trading regimen, you may find that the quality of your swing trades and/or trend-following trades may increase by a noticeable degree. By the way, ALXN did fire a swing buy signal at the close on Wednesday July 25, 2012; a break above $105.32 triggers a new long entry in this highly volatile biotech issue. Remember to keep your risks at no more than 1% to 2% if you do decide to take this trade setup. See Figure 4. |

|
| FIGURE 3: BOTTOM FIVE SELECT SECTOR FUNDS. The bottom five Select Sector funds, ranked according to their relative strength vs. the .OEX over the past calendar quarter. |
| Graphic provided by: MetaStock. |
| Graphic provided by: MetaStock Explorer. |
| |

|
| FIGURE 4: ALXN. Alexion Pharmaceuticals fires a new RMO swing buy setup signal at the close on July 25, 2012. |
| Graphic provided by: MetaStock. |
| Graphic provided by: MetaStock Explorer. |
| |
Donald W. Pendergast is a financial markets consultant who offers specialized services to stock brokers and high net worth individuals who seek a better bottom line for their portfolios.
| Title: | Writer, market consultant |
| Company: | Linear Trading Systems LLC |
| Jacksonville, FL 32217 | |
| Phone # for sales: | 904-239-9564 |
| E-mail address: | lineartradingsys@gmail.com |
Traders' Resource Links | |
| Linear Trading Systems LLC has not added any product or service information to TRADERS' RESOURCE. | |
Click here for more information about our publications!
PRINT THIS ARTICLE

Request Information From Our Sponsors
- StockCharts.com, Inc.
- Candle Patterns
- Candlestick Charting Explained
- Intermarket Technical Analysis
- John Murphy on Chart Analysis
- John Murphy's Chart Pattern Recognition
- John Murphy's Market Message
- MurphyExplainsMarketAnalysis-Intermarket Analysis
- MurphyExplainsMarketAnalysis-Visual Analysis
- StockCharts.com
- Technical Analysis of the Financial Markets
- The Visual Investor
- VectorVest, Inc.
- Executive Premier Workshop
- One-Day Options Course
- OptionsPro
- Retirement Income Workshop
- Sure-Fire Trading Systems (VectorVest, Inc.)
- Trading as a Business Workshop
- VectorVest 7 EOD
- VectorVest 7 RealTime/IntraDay
- VectorVest AutoTester
- VectorVest Educational Services
- VectorVest OnLine
- VectorVest Options Analyzer
- VectorVest ProGraphics v6.0
- VectorVest ProTrader 7
- VectorVest RealTime Derby Tool
- VectorVest Simulator
- VectorVest Variator
- VectorVest Watchdog
