HOT TOPICS LIST
- MACD
- Fibonacci
- RSI
- Gann
- ADXR
- Stochastics
- Volume
- Triangles
- Futures
- Cycles
- Volatility
- ZIGZAG
- MESA
- Retracement
- Aroon
INDICATORS LIST
LIST OF TOPICS
PRINT THIS ARTICLE
by Koos van der Merwe
When times are tough, look to buy a stock that pays a dividend.
Position: Buy
Koos van der Merwe
Has been a technical analyst since 1969, and has worked as a futures and options trader with First Financial Futures in Johannesburg, South Africa.
PRINT THIS ARTICLE
CUP WITH HANDLE
A Cup With A Dividend
07/31/12 07:58:51 AMby Koos van der Merwe
When times are tough, look to buy a stock that pays a dividend.
Position: Buy
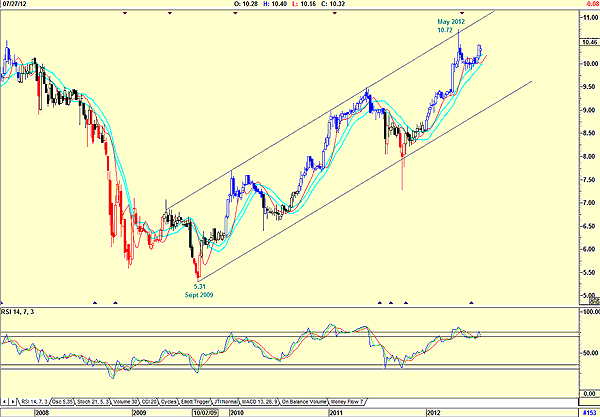
| Figure 1 is a weekly chart and shows how the price has moved from a low of $5.21 in September 2009 to a high of $10.72 by May 2012. In all that time, the dividend paid has been constant at $0.06 cents per share per month. At the price of $5.21 the yield was a very comfortable 12.83%. At today's price of $10.25, the yield is only 7%, but still a comfortable figure. Canadian residents are eligible for the enhanced dividend tax credit, which makes it more comfortable and a share to be held for the long term. |

|
| FIGURE 1: PZA, WEEKLY |
| Graphic provided by: AdvancedGET. |
| |
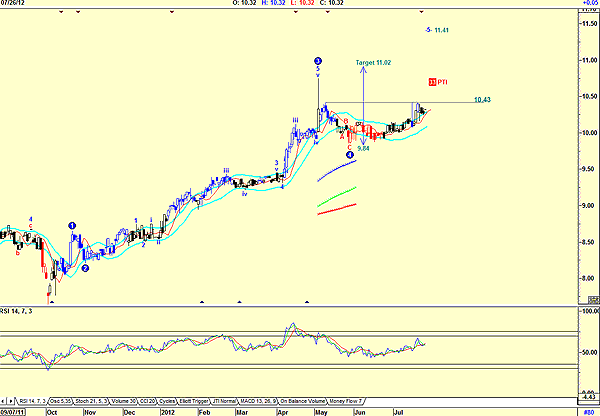
| With the daily chart (Figure 2), the first thing we see is a cup & handle pattern that seems to be developing. The target suggested should the price break above the handle at $10.43 is $11.02. The chart also shows an Elliott wave count, with a fifth wave target of $11.41. The PTI is 33, suggesting a probability of this occurring is 33%. Any PTI above 32% is acceptable. The relative strength index (RSI) is moving up, and even though it did not fall below the 32 level before rising, it is still suggesting a move to above the 70 overbought level. I would be a buyer of Pizza Pizza (PZA) should the share price break above the $10.43 level if I am chasing growth, but because I am looking for a dividend, I would take the chance and buy PZA at the current price, hoping to score should the price rise to either the $11.02 target or the $11.41 target. |

|
| FIGURE 2: PZA, DAILY |
| Graphic provided by: AdvancedGET. |
| |
Has been a technical analyst since 1969, and has worked as a futures and options trader with First Financial Futures in Johannesburg, South Africa.
| Address: | 3256 West 24th Ave |
| Vancouver, BC | |
| Phone # for sales: | 6042634214 |
| E-mail address: | petroosp@gmail.com |
Click here for more information about our publications!
PRINT THIS ARTICLE

Request Information From Our Sponsors
- StockCharts.com, Inc.
- Candle Patterns
- Candlestick Charting Explained
- Intermarket Technical Analysis
- John Murphy on Chart Analysis
- John Murphy's Chart Pattern Recognition
- John Murphy's Market Message
- MurphyExplainsMarketAnalysis-Intermarket Analysis
- MurphyExplainsMarketAnalysis-Visual Analysis
- StockCharts.com
- Technical Analysis of the Financial Markets
- The Visual Investor
- VectorVest, Inc.
- Executive Premier Workshop
- One-Day Options Course
- OptionsPro
- Retirement Income Workshop
- Sure-Fire Trading Systems (VectorVest, Inc.)
- Trading as a Business Workshop
- VectorVest 7 EOD
- VectorVest 7 RealTime/IntraDay
- VectorVest AutoTester
- VectorVest Educational Services
- VectorVest OnLine
- VectorVest Options Analyzer
- VectorVest ProGraphics v6.0
- VectorVest ProTrader 7
- VectorVest RealTime Derby Tool
- VectorVest Simulator
- VectorVest Variator
- VectorVest Watchdog
