HOT TOPICS LIST
- MACD
- Fibonacci
- RSI
- Gann
- ADXR
- Stochastics
- Volume
- Triangles
- Futures
- Cycles
- Volatility
- ZIGZAG
- MESA
- Retracement
- Aroon
INDICATORS LIST
LIST OF TOPICS
PRINT THIS ARTICLE
by Donald W. Pendergast, Jr.
Shares of Ford Motor Co. have been in a steady decline since April 2012, but signs of accumulation are now evident.
Position: N/A
Donald W. Pendergast, Jr.
Donald W. Pendergast is a financial markets consultant who offers specialized services to stock brokers and high net worth individuals who seek a better bottom line for their portfolios.
PRINT THIS ARTICLE
OVERBOUGHT OVERSOLD
Ford Motor Ready To Drive Higher?
07/30/12 11:37:49 AMby Donald W. Pendergast, Jr.
Shares of Ford Motor Co. have been in a steady decline since April 2012, but signs of accumulation are now evident.
Position: N/A
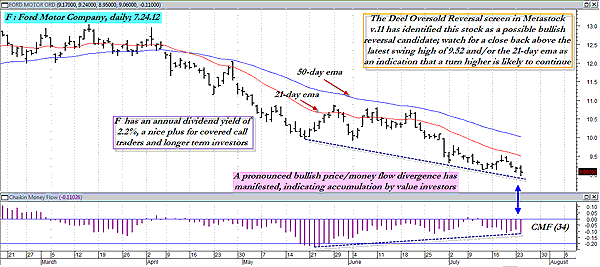
| The Deel oversold reversal screen is an exploration that comes standard with MetaStock 11 and is a very effective tool for traders who like to build watchlists of stocks that may be close to making a bullish turn after having substantial declines. Running it after the close on Tuesday, July 24, 2012, revealed that of all Standard & Poor's 100 (.OEX) components, only shares of Ford Motor (F) were identified by the exploration as a possible turnaround candidate. Here's a look at Ford's daily chart now, along with some ideas on how to get positioned for a potential reversal in this key large-cap issue. See Figure 1. |

|
| FIGURE 1: FORD, DAILY. As shares of Ford Motor continue to decline, accumulation by bottom fishers and other value investors has ramped up. |
| Graphic provided by: MetaStock. |
| |
| Ford peaked at 12.65 on April 2, 2012, and then simply began to disintegrate, dropping all the way down to 9.03 on July 23, 2012 -- a loss of nearly 29% -- and is currently trading at about 9.04 as this is written. About the only good thing that happened because of the drop is the fact that the company's dividend yield has now risen to 2.2% -- about two to three times the yield of a one-year CD at your local bank. With the stock trading well below its 200-, 50-, and 21-day exponential moving averages (EMAs), the stock certainly qualifies as being in bearish territory, and with a confirmed downtrend (lower swing highs and lower swing lows) to boot. As depressing as that is for long-term shareholders, there are some potentially bullish developments under way, such as: 1. The 34-period Chaikin money flow (CMF)(34) histogram is confirming a noticeably bullish price/money flow divergence, even as 2. The stock has just dropped off the weakest of the weak four-week relative strength list (vs. the .OEX), indicating some renewed interest in the stock by bottom fishers and other value investors. In a world of artificially low interests rates, investors are always on the lookout for a decent yield on their investments, and with Ford shares offering 2.20% near a likely bullish reversal point, the odds are good that this stock will begin to recover at least some of its spring/summer 2012 losses over the next month or two. The dominant price cycle in the .OEX, the 34-week one, is still in rising mode, and as the broad markets begin to rise along with that cycle again, Ford shares should also be buoyed as the tide lifts most boats in the broad market higher. See Figure 2. |

|
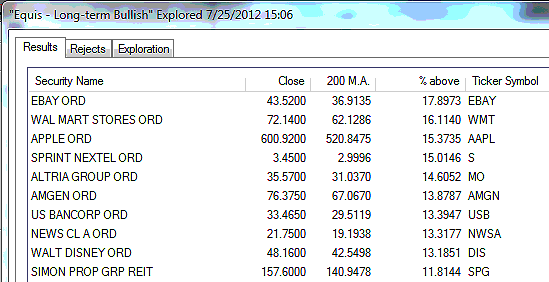
| FIGURE 2: OEX COMPONENTS. The 10 .OEX components that are trading at the highest level above their respective 200-day exponential moving averages. |
| Graphic provided by: MetaStock. |
| Graphic provided by: MetaStock Explorer. |
| |
| Depending on your level of bullishness, here are three ways you might consider playing Ford here: 1. Initiate a near-term covered-call trade. The August '12 $9.00 calls are fetching about 0.20 ($20 per contract before commissions and slippage) and feature outstanding open interest of 41,140 contracts and a decent bid-ask spread. 2. Consider selling the August '12 $9.00 puts. These are selling for 0.29 and also feature healthy open interest of 11,159 contracts and a 0.01 bid-ask spread; with less than a month till expiration, these puts will shed time value at an exponentially increasing rate, putting the odds a little more in your favor with each passing day. If you sell it and the option drops to 0.05 or less, just buy it back and walk away happy; if it jumps to 0.55 or above, buy it back and be glad you didn't lose too much dough on the trade (but remember, the odds of a bullish reversal are already in your favor; otherwise, you wouldn't even consider a trade like this, right?). 3. You can also run this as a simple swing trade. Buy on a stop if F rises above $9.24 and then place a stop-loss at $8.93; manage the position with a two-bar trailing stop of the daily lows and consider taking half your position off on a rise into the 21-day EMA area near $9.50. |
| Whichever trade style you favor, always keep your risks small by limiting your maximum loss per trade to no more than 1% to 2% of your account value. Doing so helps ensure you'll be around long enough to reap the rewards of a satisfying, rewarding trading and investing career. |
Donald W. Pendergast is a financial markets consultant who offers specialized services to stock brokers and high net worth individuals who seek a better bottom line for their portfolios.
| Title: | Writer, market consultant |
| Company: | Linear Trading Systems LLC |
| Jacksonville, FL 32217 | |
| Phone # for sales: | 904-239-9564 |
| E-mail address: | lineartradingsys@gmail.com |
Traders' Resource Links | |
| Linear Trading Systems LLC has not added any product or service information to TRADERS' RESOURCE. | |
Click here for more information about our publications!
PRINT THIS ARTICLE

Request Information From Our Sponsors
- StockCharts.com, Inc.
- Candle Patterns
- Candlestick Charting Explained
- Intermarket Technical Analysis
- John Murphy on Chart Analysis
- John Murphy's Chart Pattern Recognition
- John Murphy's Market Message
- MurphyExplainsMarketAnalysis-Intermarket Analysis
- MurphyExplainsMarketAnalysis-Visual Analysis
- StockCharts.com
- Technical Analysis of the Financial Markets
- The Visual Investor
- VectorVest, Inc.
- Executive Premier Workshop
- One-Day Options Course
- OptionsPro
- Retirement Income Workshop
- Sure-Fire Trading Systems (VectorVest, Inc.)
- Trading as a Business Workshop
- VectorVest 7 EOD
- VectorVest 7 RealTime/IntraDay
- VectorVest AutoTester
- VectorVest Educational Services
- VectorVest OnLine
- VectorVest Options Analyzer
- VectorVest ProGraphics v6.0
- VectorVest ProTrader 7
- VectorVest RealTime Derby Tool
- VectorVest Simulator
- VectorVest Variator
- VectorVest Watchdog
