HOT TOPICS LIST
- MACD
- Fibonacci
- RSI
- Gann
- ADXR
- Stochastics
- Volume
- Triangles
- Futures
- Cycles
- Volatility
- ZIGZAG
- MESA
- Retracement
- Aroon
INDICATORS LIST
LIST OF TOPICS
PRINT THIS ARTICLE
by Donald W. Pendergast, Jr.
Despite a deep intraday pullback, the .OEX staged an afternoon rebound as higher-degree cycles provided support.
Position: N/A
Donald W. Pendergast, Jr.
Donald W. Pendergast is a financial markets consultant who offers specialized services to stock brokers and high net worth individuals who seek a better bottom line for their portfolios.
PRINT THIS ARTICLE
TECHNICAL ANALYSIS
PENDY'S PICKS: July 24, 2012
07/24/12 08:48:06 AMby Donald W. Pendergast, Jr.
Despite a deep intraday pullback, the .OEX staged an afternoon rebound as higher-degree cycles provided support.
Position: N/A
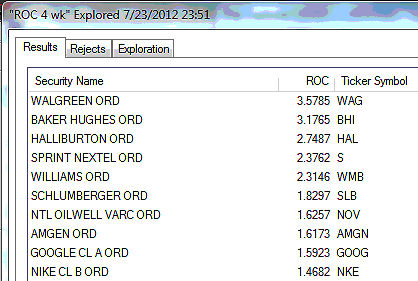
| The .OEX (Standard & Poor's 100) finished Monday's trading session at $621.74, declining by 0.77%. The index pulled back sharply during the early part of the trading session, dipping down to $615.44 before staging a mild comeback by the time of the closing bell. With the larger degree 16-week and 34-week cycles still in rising mode, it will be interesting to see if this short yet swift pullback will have been enough to satisfy the lower-degree cycles need to bottom before rising with the 16-week and 34-week ones. Figure 1 shows us the strongest four-week relative strength (RS) performers in the .OEX; Walgreen's (WAG) remains very strong, with the oil exploration/production and oil services stocks still leading the sector rotation charge among the large caps. Baker Hughes (BHI), Schlumberger (SLB), Halliburton (HAL), Occidental Petroleum (OXY), Williams Companies (WMB), and National Oilwell Varco (NOV) are all very strong now, although Occidental Petroleum (OXY) has disappeared from this top 10 list for the time being. There is a decent amount of diversity among the other four stocks: Google (GOOG), Sprint Nextel (S), Amgen Inc. (AMGN), and Nike (NKE) all hail from radically different industry groups and/or sectors. |

|
| FIGURE 1: STRONGEST COMPONENTS. The 10 strongest S&P 100 (.OEX) components over the past month, as of Monday, July 23, 2012. |
| Graphic provided by: MetaStock. |
| Graphic provided by: MetaStock Explorer. |
| |
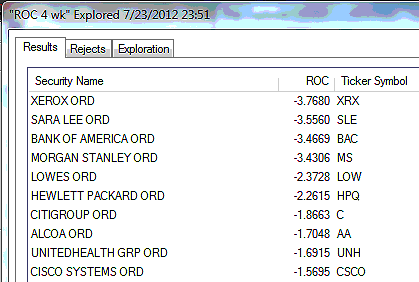
| Figure 2 is a look at the weakest four-week relative strength (RS) performers in the .OEX; note that shares of Xerox (X) are still at the top of the weak RS pile and that Hewlett Packard (HPQ) continues to lag the .OEX as well. Sara Lee (SLE) remains in a state of share price trauma, but note that Ford Motor (F) has finally made a graceful exit from this list. Alcoa (AA) is an interesting new addition; the metals giant is at a new 52-week low, but its relatively small dividend yield of 1.5% may not be enough to entice value investors to deploy some capital into this key Dow Jones, S&P 100, and S&P 500 component -- yet. |

|
| FIGURE 2: WEAKEST COMPONENTS. The 10 weakest S&P 100 (.OEX) components over the past month, as of Monday, July 23, 2012. |
| Graphic provided by: MetaStock. |
| Graphic provided by: MetaStock Explorer. |
| |
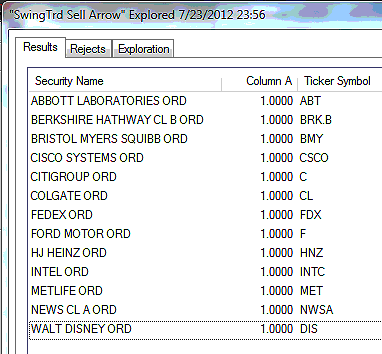
| Figure 3 are the S&P 100 components giving RMO swing sell setup signals; 13% of the .OEX components issued new RMO swing sell signals on Monday. There were no swing buy setup signals at all. While having so many stocks-issue swing sell setups looks awfully bearish, bear in mind that these stocks will only trigger short entries on declines below their respective Monday lows and that Monday's deep intraday pullback in the index may actually have been a "wash and rinse" job -- one designed by the smart money to lure inexperienced or inordinately bearish traders into establishing new short positions just before the smart money begins buying en masse, thus causing short squeezes and subsequent profits for the smart money folks who are well positioned to profit. Remember that several lower-degree cycles are close to bottoming in the .OEX even as the 16-week and 34-week cycles continue to grind higher. Be nimble and keep your account risk small if you do decide to go short any of these stocks on a decline below their Monday lows, as this market could lurch higher at any moment. |

|
| FIGURE 3: SWING SELL SIGNALS. The S&P 100 (.OEX) components issuing RMO swing sell signals at the close of trading on Monday, July 23, 2012; 13% of all .OEX components fired sell setup signals during this session, with no new buy setup signals being issued. |
| Graphic provided by: MetaStock. |
| Graphic provided by: MetaStock Explorer. |
| |
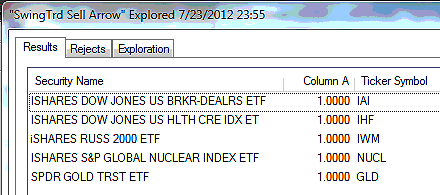
| In the world of exchange traded funds (ETFs), we have five sell setup signals to track -- the iShares Nuclear Energy (NUCL), Broker-Dealers (IAI), Medical Devices (IHI), Health Care index (IHF), SPDRs Gold Trust (GLD), and the Russell 2000 (IWM) ETFs (Figure 4). There were no swing buy setup signals in any of the ETFs that Pendy's Picks tracks. As mentioned previously regarding the stock setups, be very careful if going short here, as the current cycle dynamics in the .OEX and other big stock indexes creates a prime opportunity for the market to reverse higher. |

|
| FIGURE 4: SWING SELL SETUP SIGNALS. The ETFs that fired new RMO swing sell setup signals as of the close of trading on Monday, July 23, 2012; there were no new RMO swing buy setup signals on Monday. |
| Graphic provided by: MetaStock. |
| Graphic provided by: MetaStock Explorer. |
| |
| Monday's sharp intraday decline and dramatic rebound in the .OEX and other US stock indexes is sending a message to savvy traders and investors that strong support exists in the market and that it may be prudent to respect the power of several longer-term rising price cycles in the .OEX. Begin preparing a shopping list of large caps with above-average dividends and rising earnings growth rates now so you'll be well prepared for a possible midsummer rally. As always, trade wisely until we meet here again. |
Donald W. Pendergast is a financial markets consultant who offers specialized services to stock brokers and high net worth individuals who seek a better bottom line for their portfolios.
| Title: | Writer, market consultant |
| Company: | Linear Trading Systems LLC |
| Jacksonville, FL 32217 | |
| Phone # for sales: | 904-239-9564 |
| E-mail address: | lineartradingsys@gmail.com |
Traders' Resource Links | |
| Linear Trading Systems LLC has not added any product or service information to TRADERS' RESOURCE. | |
Click here for more information about our publications!
Comments

|

Request Information From Our Sponsors
- StockCharts.com, Inc.
- Candle Patterns
- Candlestick Charting Explained
- Intermarket Technical Analysis
- John Murphy on Chart Analysis
- John Murphy's Chart Pattern Recognition
- John Murphy's Market Message
- MurphyExplainsMarketAnalysis-Intermarket Analysis
- MurphyExplainsMarketAnalysis-Visual Analysis
- StockCharts.com
- Technical Analysis of the Financial Markets
- The Visual Investor
- VectorVest, Inc.
- Executive Premier Workshop
- One-Day Options Course
- OptionsPro
- Retirement Income Workshop
- Sure-Fire Trading Systems (VectorVest, Inc.)
- Trading as a Business Workshop
- VectorVest 7 EOD
- VectorVest 7 RealTime/IntraDay
- VectorVest AutoTester
- VectorVest Educational Services
- VectorVest OnLine
- VectorVest Options Analyzer
- VectorVest ProGraphics v6.0
- VectorVest ProTrader 7
- VectorVest RealTime Derby Tool
- VectorVest Simulator
- VectorVest Variator
- VectorVest Watchdog
