HOT TOPICS LIST
- MACD
- Fibonacci
- RSI
- Gann
- ADXR
- Stochastics
- Volume
- Triangles
- Futures
- Cycles
- Volatility
- ZIGZAG
- MESA
- Retracement
- Aroon
INDICATORS LIST
LIST OF TOPICS
PRINT THIS ARTICLE
by Chaitali Mohile
Peabody Energy Corp. has been moving in a long-term descending channel.
Position: Hold
Chaitali Mohile
Active trader in the Indian stock markets since 2003 and a full-time writer. Trading is largely based upon technical analysis.
PRINT THIS ARTICLE
CHANNEL LINES
BTU In Bearish Mood
07/26/12 11:09:16 AMby Chaitali Mohile
Peabody Energy Corp. has been moving in a long-term descending channel.
Position: Hold
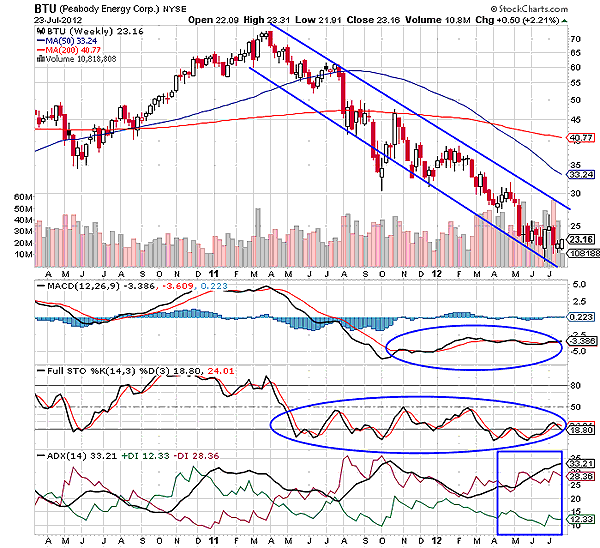
| An intermediate uptrend of Peabody Energy Corp. (BTU) reversed to a robust downtrend in mid-2011. A rally took the price to $70. After that, the stock entered a fresh bearish trend, which gradually turned stronger, forming a series of lower lows and highs. These series formed a descending channel (Figure 1). Soon, the channel broke the 50-day and 200-day moving average (MA) supports. The declining price rally moved perfectly within the upper and lower trendline of the channel. BTU plunged below $25, losing almost 55 points from the top. |

|
| FIGURE 1: BTU, WEEKLY |
| Graphic provided by: StockCharts.com. |
| |
| The downtrend indicated by the average directional index (ADX) (14) became overheated in the middle of the rally, highlighting the possibility of a trend reversal. However, the price rally did not change its direction; nor did it breach the upper trendline resistance. This reflected the bearish strength in the price rally. The full stochastic (14,3,3) was range-bound between 50 and 30 levels, suggesting weak momentum. The moving average convergence/divergence (MACD) (12,26,9) remained negative throughout the move. This scenario forced BTU to remain bearish and continue to fall. Currently, the downtrend is well developed, and hence the stock is likely to witness more downside. |

|
| FIGURE 2: BTU, MONTHLY |
| Graphic provided by: StockCharts.com. |
| |
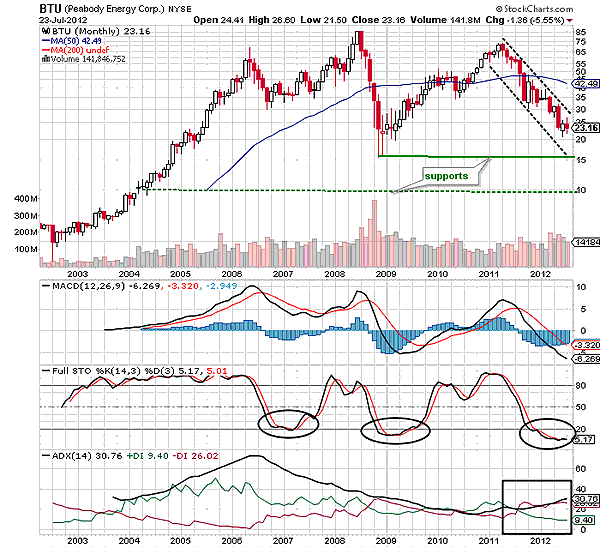
| On the monthly chart of BTU that you see in Figure 2, you see the descending channel as well. Since the oscillator is highly oversold, the stock is likely to move toward the upper trendline resistance at 30 levels. Earlier, an oversold stochastic had initiated strong bullish rallies. The other two indicators (MACD (12,26,9) and ADX) in Figure 2 also showed bullish reversal possibilities, which helped the stock to begin a fresh upward rally. |
| However, the current picture you see in Figure 2 is completely different. There, the MACD (12,26,9) is negative and the downtrend is developing, and thus, we cannot anticipate a bullish breakout of the descending channel. Although such types of breakout are major trend reversal signals, BTU is unlikely to undergo such a breakout in the current scenario. Since the stock has already plunged more than 50 points, short-term trading is possible with a target of $15. Traders can observe the price movement near support levels before finalizing their future plan of action. |
| To conclude, BTU would continue to move within the descending channel. Currently, a bullish breakout has not appeared on any of the charts. |
Active trader in the Indian stock markets since 2003 and a full-time writer. Trading is largely based upon technical analysis.
| Company: | Independent |
| Address: | C1/3 Parth Indraprasth Towers. Vastrapur |
| Ahmedabad, Guj 380015 | |
| E-mail address: | chaitalimohile@yahoo.co.in |
Traders' Resource Links | |
| Independent has not added any product or service information to TRADERS' RESOURCE. | |
Click here for more information about our publications!
PRINT THIS ARTICLE

Request Information From Our Sponsors
- StockCharts.com, Inc.
- Candle Patterns
- Candlestick Charting Explained
- Intermarket Technical Analysis
- John Murphy on Chart Analysis
- John Murphy's Chart Pattern Recognition
- John Murphy's Market Message
- MurphyExplainsMarketAnalysis-Intermarket Analysis
- MurphyExplainsMarketAnalysis-Visual Analysis
- StockCharts.com
- Technical Analysis of the Financial Markets
- The Visual Investor
- VectorVest, Inc.
- Executive Premier Workshop
- One-Day Options Course
- OptionsPro
- Retirement Income Workshop
- Sure-Fire Trading Systems (VectorVest, Inc.)
- Trading as a Business Workshop
- VectorVest 7 EOD
- VectorVest 7 RealTime/IntraDay
- VectorVest AutoTester
- VectorVest Educational Services
- VectorVest OnLine
- VectorVest Options Analyzer
- VectorVest ProGraphics v6.0
- VectorVest ProTrader 7
- VectorVest RealTime Derby Tool
- VectorVest Simulator
- VectorVest Variator
- VectorVest Watchdog
