HOT TOPICS LIST
- MACD
- Fibonacci
- RSI
- Gann
- ADXR
- Stochastics
- Volume
- Triangles
- Futures
- Cycles
- Volatility
- ZIGZAG
- MESA
- Retracement
- Aroon
INDICATORS LIST
LIST OF TOPICS
PRINT THIS ARTICLE
by Matt Blackman
Stock markets around the globe have been looking increasingly unhealthy in July. Here are some chart patterns that will interest the technical savvy searching for confirmation.
Position: Sell
Matt Blackman
Matt Blackman is a full-time technical and financial writer and trader. He produces corporate and financial newsletters, and assists clients in getting published in the mainstream media. He is the host of TradeSystemGuru.com. Matt has earned the Chartered Market Technician (CMT) designation. Find out what stocks and futures Matt is watching on Twitter at www.twitter.com/RatioTrade
PRINT THIS ARTICLE
HEAD & SHOULDERS
More Bearish Omens?
07/25/12 08:38:38 AMby Matt Blackman
Stock markets around the globe have been looking increasingly unhealthy in July. Here are some chart patterns that will interest the technical savvy searching for confirmation.
Position: Sell
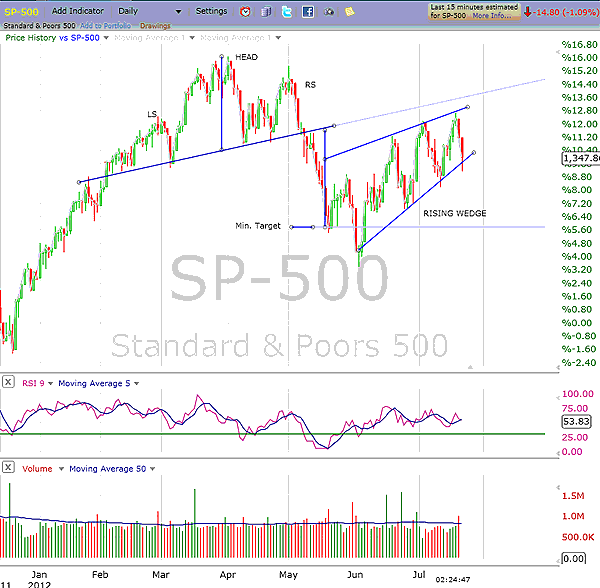
| In my last Traders.com Advantage article "Market Challenges Are Not Limited To Politicos In Europe," I highlighted some troubling intermarket relationships that should alert traders and investors about the potential for more weakness ahead. Here are two more reasons for concern. As we see in Figure 1, the head & shoulders top pattern that was confirmed for the Standard & Poor's 500 in May 2012 quickly hit its minimum projected target but then appeared to return to recovery mode. |

|
| FIGURE 1: SPX, DAILY. This chart shows the bearish patterns on the SPX. |
| Graphic provided by: FreeStockCharts.com. |
| |
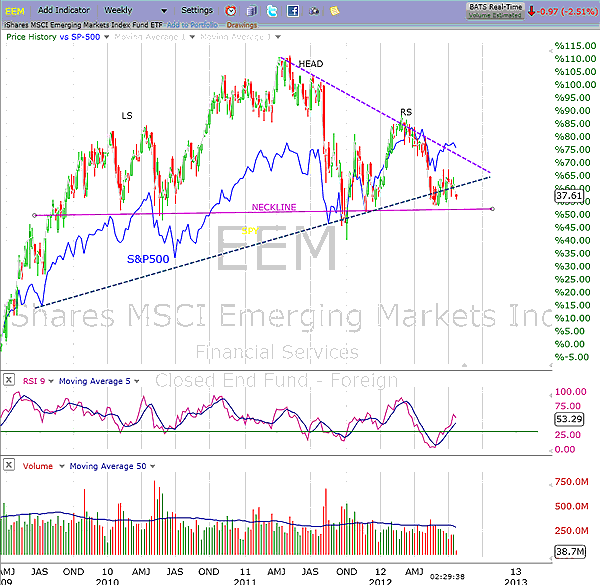
| Unfortunately for the bulls at least, it looks to be forming another bearish pattern in the form of a rising wedge on the daily chart. This makes perfect sense if the index is indeed getting ready to resume its downtrend. However, taken independently, this is not enough justification to sell short or head for the exits just yet. But this next chart may be enough justification. It provides a weekly prospective showing that the summer weakness is not limited to US stocks alone. As we see in Figure 2, the iShares MSCI Emerging Markets ETF (EEM) is setting up what looks like a bearish head & shoulder top pattern with a neckline around $36 that, if breached, has a minimum projected target of $22.60, which is down 37%. |

|
| FIGURE 2: EEM, WEEKLY. This chart together with the SPX shows the potential bearish head & shoulders setting up as well as negative divergence with the US index (see dashed trendlines of the SPX in blue and the EEM in purple). |
| Graphic provided by: FreeStockCharts.com. |
| |
| Fundamental investors may find it easier to take solace in improving earnings and focus on the glass-half-full economic statistics discussed in the media by many pundits and political spin doctors who are trying to pump up the economy leading into the US election on November 6. |
| Technicians don't have that luxury. An increasing number of indicators, including industrial commodity prices, especially copper, weakening emerging market stock prices, falling bond yields in the US, soaring bond spreads in Spain, Italy, and Portugal, together with a falling euro all highlight deteriorating economies around the globe and rising fiscal risks in Europe. |
Matt Blackman is a full-time technical and financial writer and trader. He produces corporate and financial newsletters, and assists clients in getting published in the mainstream media. He is the host of TradeSystemGuru.com. Matt has earned the Chartered Market Technician (CMT) designation. Find out what stocks and futures Matt is watching on Twitter at www.twitter.com/RatioTrade
| Company: | TradeSystemGuru.com |
| Address: | Box 2589 |
| Garibaldi Highlands, BC Canada | |
| Phone # for sales: | 604-898-9069 |
| Fax: | 604-898-9069 |
| Website: | www.tradesystemguru.com |
| E-mail address: | indextradermb@gmail.com |
Traders' Resource Links | |
| TradeSystemGuru.com has not added any product or service information to TRADERS' RESOURCE. | |
Click here for more information about our publications!
Comments
Date: 07/25/12Rank: 4Comment:
Date: 07/26/12Rank: 5Comment:

|

Request Information From Our Sponsors
- StockCharts.com, Inc.
- Candle Patterns
- Candlestick Charting Explained
- Intermarket Technical Analysis
- John Murphy on Chart Analysis
- John Murphy's Chart Pattern Recognition
- John Murphy's Market Message
- MurphyExplainsMarketAnalysis-Intermarket Analysis
- MurphyExplainsMarketAnalysis-Visual Analysis
- StockCharts.com
- Technical Analysis of the Financial Markets
- The Visual Investor
- VectorVest, Inc.
- Executive Premier Workshop
- One-Day Options Course
- OptionsPro
- Retirement Income Workshop
- Sure-Fire Trading Systems (VectorVest, Inc.)
- Trading as a Business Workshop
- VectorVest 7 EOD
- VectorVest 7 RealTime/IntraDay
- VectorVest AutoTester
- VectorVest Educational Services
- VectorVest OnLine
- VectorVest Options Analyzer
- VectorVest ProGraphics v6.0
- VectorVest ProTrader 7
- VectorVest RealTime Derby Tool
- VectorVest Simulator
- VectorVest Variator
- VectorVest Watchdog
