HOT TOPICS LIST
- MACD
- Fibonacci
- RSI
- Gann
- ADXR
- Stochastics
- Volume
- Triangles
- Futures
- Cycles
- Volatility
- ZIGZAG
- MESA
- Retracement
- Aroon
INDICATORS LIST
LIST OF TOPICS
PRINT THIS ARTICLE
by Donald W. Pendergast, Jr.
The .OEX continues with bullish follow-through, having now made a higher close in four of the last five trading sessions.
Position: N/A
Donald W. Pendergast, Jr.
Donald W. Pendergast is a financial markets consultant who offers specialized services to stock brokers and high net worth individuals who seek a better bottom line for their portfolios.
PRINT THIS ARTICLE
TECHNICAL ANALYSIS
PENDY'S PICKS: July 20, 2012
07/20/12 10:00:30 AMby Donald W. Pendergast, Jr.
The .OEX continues with bullish follow-through, having now made a higher close in four of the last five trading sessions.
Position: N/A
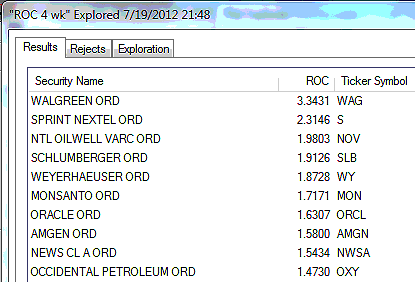
| The .OEX (Standard & Poor's 100) finished Thursday's trading session at $632.01, rising by 0.28%. Since last week's bullish reversal on Friday, July 13, the index has closed higher during three of the following four trading sessions and may be closing in on a minor cycle high zone. However, with the 34-week cycle still rising and the 16-week cycle not expected to peak for another 10 to 12 trading sessions, the probabilities for further upside remain positive. Figure 1 shows us the strongest four-week relative strength (RS) performers in the .OEX. Walgreen's (WAG) has suddenly shot to the top of the rankings; news of a mutually acceptable agreement between Express Scripts (ESRX) helped give WAG the proverbial shot in the arm needed to entice traders and investors to pile back into the stock on Thursday. Weyerhaeuser (WY) is still strong, as is Sprint Nextel (S). Schlumberger (SLB), Occidental Petroleum (OXY), and National Oilwell Varco (NOV) are still showing us that Big Oil is a potentially attractive place to deploy trading capital for the time being. NewsCorp (NWSA), although losing a bit of steam lately, is still a member of the top 10 relative strength (RS) ranking list. |

|
| FIGURE 1: STRONGEST COMPONENTS. The 10 strongest S&P 100 (.OEX) components over the past month, as of Thursday, July 19, 2012. |
| Graphic provided by: MetaStock. |
| Graphic provided by: MetaStock Explorer. |
| |
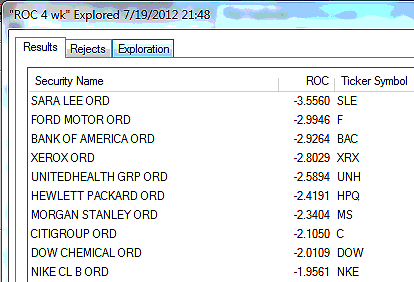
| Figure 2 is a look at the weakest four-week relative strength performers in the .OEX. Sara Lee (SLE) and Ford Motor (F) seem determined to set a world record for times they appear at or near the top of the weak RS list; Nike (NKE) is finally looking as if it may be ready to drop out of the weak RS list. Perhaps Friday's trading action will be the day the stock catches a new bid, who knows? Morgan Stanley (MS), Bank of America (BAC), and Citigroup (C) suggest that the "sell financials, buy Big Oil" stock rotation theme has caught on with the Wall Street crowd; with crude oil back up around $90 and the world seemingly awash in banking scandals, perhaps that is a very wise theme indeed. |

|
| FIGURE 2: WEAKEST COMPONENTS. The 10 weakest S&P 100 (.OEX) components over the past month, as of Thursday, July 19, 2012. |
| Graphic provided by: MetaStock. |
| Graphic provided by: MetaStock Explorer. |
| |
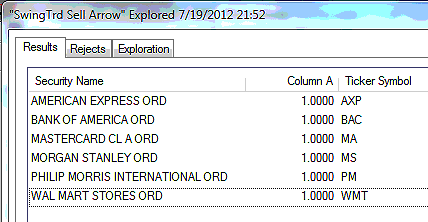
| Figure 3 are the S&P 100 components giving RMO swing sell setup signals; 6% of the .OEX components issued new RMO swing sell signals on Thursday. There were also four swing buy setup signals as well. This ratio of more bearish setups than bullish comes as the .OEX is at or close to a peak in its 32-day cycle; its 61-day cycle is already falling, so if most of these short setups get triggered on a drop below their Thursday lows, a correction of the latest upswing is almost a certainty. If only a few (or even none) get triggered, then the current rally likely still has another week or two left to run higher with only mild pullbacks along the way. Note that four of the six sell setups hail from the financial sector -- AXP, MS, BAC, and MA -- which is the single largest component sector within the .OEX. |

|
| FIGURE 3: SWING SELL SIGNALS. The S&P 100 (.OEX) components issuing RMO swing sell signals at the close of trading on Thursday, July 19, 2012; 6% of all .OEX components fired sell setup signals during this session, with four new buy setup signals also being issued. |
| Graphic provided by: MetaStock. |
| Graphic provided by: MetaStock Explorer. |
| |
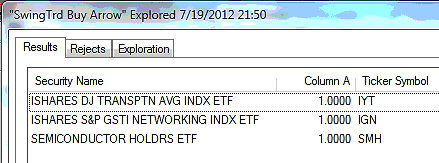
| On the exchange traded funds (ETFs) side of the equation, we have three new buy setup signals to track - the iShares Transportation (IYT), Networking (IGN) and the Semiconductor HOLDRs (SMH) ETFs. There was one swing sell setup signal, and that being the iShares US Home Construction Index fund (ITB). See Figure 4. |

|
| FIGURE 4: SWING BUY SIGNALS. The ETFs that fired new RMO swing buy setup signals as of the close of trading on Thursday, July 19, 2012. There was one new RMO swing sell setup signal that also printed at the close of trading on Thursday. |
| Graphic provided by: MetaStock. |
| Graphic provided by: MetaStock Explorer. |
| |
| Thursday's bullish follow, although minor, continues to validate the current cyclical analysis time/price projections for the .OEX. The maximum price target for the current upswing (that began on June 4, 2012) has actually been upped by to $746.93, up from $691.19. As mentioned in yesterday's edition of Pendy's Picks, the time window for this maximum possible advance to expire has now been shortened to August 31, 2012. It's dangerous to make financial market predictions, but if traders get some good news out of Europe regarding a sane, long-term solution to the debt mess/socialist policy failures of the last 50 to 75 years and if the global banking scandals get papered over (slaps on the wrist for everyone involved -- the line forms to the left, and no wrongdoing need be admitted by the guilty parties, of course!) soon, then there could indeed be a nice continuation of the rally rooted in the June 4, 2012, broad market lows. As always, trade wisely until we meet here again. |
Donald W. Pendergast is a financial markets consultant who offers specialized services to stock brokers and high net worth individuals who seek a better bottom line for their portfolios.
| Title: | Writer, market consultant |
| Company: | Linear Trading Systems LLC |
| Jacksonville, FL 32217 | |
| Phone # for sales: | 904-239-9564 |
| E-mail address: | lineartradingsys@gmail.com |
Traders' Resource Links | |
| Linear Trading Systems LLC has not added any product or service information to TRADERS' RESOURCE. | |
Click here for more information about our publications!
Comments

Request Information From Our Sponsors
- StockCharts.com, Inc.
- Candle Patterns
- Candlestick Charting Explained
- Intermarket Technical Analysis
- John Murphy on Chart Analysis
- John Murphy's Chart Pattern Recognition
- John Murphy's Market Message
- MurphyExplainsMarketAnalysis-Intermarket Analysis
- MurphyExplainsMarketAnalysis-Visual Analysis
- StockCharts.com
- Technical Analysis of the Financial Markets
- The Visual Investor
- VectorVest, Inc.
- Executive Premier Workshop
- One-Day Options Course
- OptionsPro
- Retirement Income Workshop
- Sure-Fire Trading Systems (VectorVest, Inc.)
- Trading as a Business Workshop
- VectorVest 7 EOD
- VectorVest 7 RealTime/IntraDay
- VectorVest AutoTester
- VectorVest Educational Services
- VectorVest OnLine
- VectorVest Options Analyzer
- VectorVest ProGraphics v6.0
- VectorVest ProTrader 7
- VectorVest RealTime Derby Tool
- VectorVest Simulator
- VectorVest Variator
- VectorVest Watchdog
