HOT TOPICS LIST
- MACD
- Fibonacci
- RSI
- Gann
- ADXR
- Stochastics
- Volume
- Triangles
- Futures
- Cycles
- Volatility
- ZIGZAG
- MESA
- Retracement
- Aroon
INDICATORS LIST
LIST OF TOPICS
PRINT THIS ARTICLE
by Donald W. Pendergast, Jr.
The .OEX continues to follow through in the wake of last week's bullish reversal.
Position: N/A
Donald W. Pendergast, Jr.
Donald W. Pendergast is a financial markets consultant who offers specialized services to stock brokers and high net worth individuals who seek a better bottom line for their portfolios.
PRINT THIS ARTICLE
TECHNICAL ANALYSIS
PENDY'S PICKS: July 19, 2012
07/19/12 08:58:52 AMby Donald W. Pendergast, Jr.
The .OEX continues to follow through in the wake of last week's bullish reversal.
Position: N/A
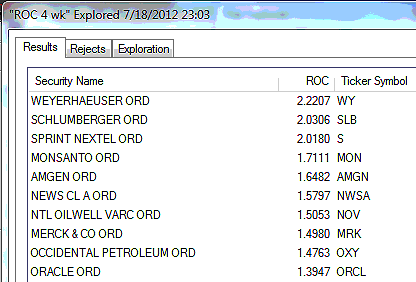
| The .OEX (Standard & Poor's 100) finished Wednesday's trading session at $630.26, rising by 0.62%; last Friday's bullish reversal in the index was no isolated incident, and the solid follow-through on Tuesday and Wednesday indeed confirmed that the index is in an upswing heavily influenced by its rising 34-week cycle. The shorter 16-week cycle is not due to top until sometime around August 1, 2012, so the bulls definitely have a bit of time to milk the maximum amount of gains from their various long trade signals between now and then. Figure 1 show us the strongest four-week relative strength (RS) performers in the .OEX; Weyerhaeuser (WY) is still the top dog in this group, with Schlumberger (SLB) quickly rising to second place. We now have three oil sector giants in the top 10 list -- SLB, Occidental Petroleum (OXY), and National Oilwell Varco (NOV). Sprint Nextel (S) is still doing well, as is NewsCorp (NWSA), Amgen (AMGN), Monsanto (MON), and Merck (MRK). There appears to be no reason why any of these stocks shouldn't also rise along with the .OEX in the next couple of weeks. |

|
| FIGURE 1: STRONGEST COMPONENTS. The 10 strongest S&P 100 (.OEX) components over the past month, as of Wednesday, July 18, 2012. |
| Graphic provided by: MetaStock. |
| Graphic provided by: MetaStock Explorer. |
| |
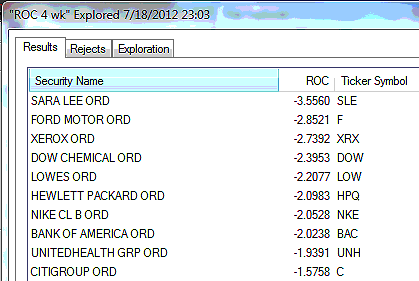
| Figure 2 is a look at the weakest four-week relative strength performers in the .OEX, with Hewlett-Packard (HPQ), Intel (INTC), and EMC Storage (EMC) still helping bring up the rear of the pack, while Sara Lee (SLE) and Ford Motor (F) appear to have rented out semi-permanent lodging at or near the top of the weak RS list. Nike (NKE), Bank of America (BAC), Dow Chemical (DOW), and Xerox (XRX) also have been clinging to their respective slots in the weak RS rankings. By the way, you don't necessarily need to use the buy/sell signals shown in the lower portion of this report to trade the stocks in the strong/weak four-week RS lists. However, whatever system you do choose to rely on should be one that has had a good rate of success in the past on a variety of financial instruments, especially in stocks. |

|
| FIGURE 2: WEAKEST COMPONENTS. The 10 weakest S&P 100 (.OEX) components over the past month, as of Wednesday, July 18, 2012. |
| Graphic provided by: MetaStock. |
| Graphic provided by: MetaStock Explorer. |
| |
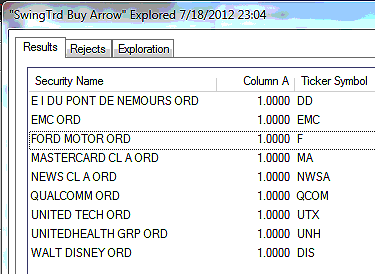
| Figure 3 are the S&P 100 components giving RMO swing buy setup signals; 9% of the .OEX components issued new RMO swing buy signals on Wednesday. The nine signals hail from a different sector and/or industry group -- manufacturing (UTX), financial (MA), health (UNH), communications (QCOM), media (NWSA), entertainment (DIS), storage devices (EMC), chemicals (DD), and autos (F). Once again, this clearly shows that this is a broad-based rally; a rise above their respective highs made on Wednesday triggers actual long entries. Note that while there were nine buy setup signals on Wednesday that there were no sell setup signals at all. This is yet another hint that the broad market's line of least resistance is still toward higher prices as the 16-week and 34-week cycles in the .OEX help prices grind higher. |

|
| FIGURE 3: SWING BUY SIGNALS. The S&P 100 (.OEX) components issuing RMO swing buy signals at the close of trading on Wednesday, July 18, 2012; 9% of all .OEX components fired buy setup signals during this session, with no new sell setup signals issued. |
| Graphic provided by: MetaStock. |
| Graphic provided by: MetaStock Explorer. |
| |
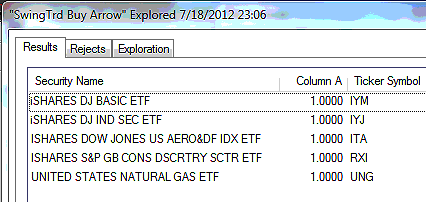
| On the exchange traded funds (ETFs) side of the equation, we have five new buy setup signals to track -- the iShares Basic Materials (IYM), Industrial Sector (IYJ), Defense and Aerospace (ITA), Global Consumer Discretionary Sector (RXI), and the US Natural Gas Fund (UNG) ETFs. Just as in the stock buy signals, note the variety of groups represented -- another clue that the current rally is indeed broad-based. There were no sell setup signals in any of the ETFs that Pendy's Picks tracks here every day, which is also very bullish. See Figure 4. |

|
| FIGURE 4: SWING BUY SIGNALS. The ETFs that fired new RMO swing buy setup signals as of the close of trading on Wednesday, July 18, 2012; there were no new RMO swing sell setup signals that also printed at the close of trading on Wednesday. |
| Graphic provided by: MetaStock. |
| Graphic provided by: MetaStock Explorer. |
| |
| Wednesday's bullish follow-through is validating the current cyclical analysis time/price projections for the .OEX. The maximum price target for the current upswing (that began on June 4, 2012) remains at $691.19. However, the time window for this maximum possible advance to expire has now been shortened to August 31, 2012; remember that cycle analysis is an ever-changing technical overlay that adapts to changing market conditions, and this shortening of the time window from late October to late August seems to imply that a sustained trending move may be possible over the next six weeks. As always, trade wisely until we meet here again. |
Donald W. Pendergast is a financial markets consultant who offers specialized services to stock brokers and high net worth individuals who seek a better bottom line for their portfolios.
| Title: | Writer, market consultant |
| Company: | Linear Trading Systems LLC |
| Jacksonville, FL 32217 | |
| Phone # for sales: | 904-239-9564 |
| E-mail address: | lineartradingsys@gmail.com |
Traders' Resource Links | |
| Linear Trading Systems LLC has not added any product or service information to TRADERS' RESOURCE. | |
Click here for more information about our publications!
PRINT THIS ARTICLE

|

Request Information From Our Sponsors
- StockCharts.com, Inc.
- Candle Patterns
- Candlestick Charting Explained
- Intermarket Technical Analysis
- John Murphy on Chart Analysis
- John Murphy's Chart Pattern Recognition
- John Murphy's Market Message
- MurphyExplainsMarketAnalysis-Intermarket Analysis
- MurphyExplainsMarketAnalysis-Visual Analysis
- StockCharts.com
- Technical Analysis of the Financial Markets
- The Visual Investor
- VectorVest, Inc.
- Executive Premier Workshop
- One-Day Options Course
- OptionsPro
- Retirement Income Workshop
- Sure-Fire Trading Systems (VectorVest, Inc.)
- Trading as a Business Workshop
- VectorVest 7 EOD
- VectorVest 7 RealTime/IntraDay
- VectorVest AutoTester
- VectorVest Educational Services
- VectorVest OnLine
- VectorVest Options Analyzer
- VectorVest ProGraphics v6.0
- VectorVest ProTrader 7
- VectorVest RealTime Derby Tool
- VectorVest Simulator
- VectorVest Variator
- VectorVest Watchdog
