HOT TOPICS LIST
- MACD
- Fibonacci
- RSI
- Gann
- ADXR
- Stochastics
- Volume
- Triangles
- Futures
- Cycles
- Volatility
- ZIGZAG
- MESA
- Retracement
- Aroon
INDICATORS LIST
LIST OF TOPICS
PRINT THIS ARTICLE
by Donald W. Pendergast, Jr.
Shares of Gilead Sciences have just broken out of a multimonth triangle/pennant formation, receiving the benefit of a Raff MarketSpace Stock system buy signal in the process.
Position: N/A
Donald W. Pendergast, Jr.
Donald W. Pendergast is a financial markets consultant who offers specialized services to stock brokers and high net worth individuals who seek a better bottom line for their portfolios.
PRINT THIS ARTICLE
GILD Raff Buy Signal And Pennant Breakout
07/20/12 08:56:02 AMby Donald W. Pendergast, Jr.
Shares of Gilead Sciences have just broken out of a multimonth triangle/pennant formation, receiving the benefit of a Raff MarketSpace Stock system buy signal in the process.
Position: N/A
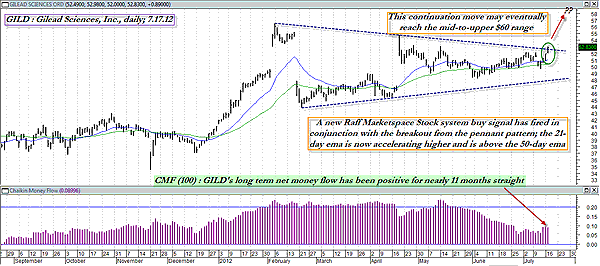
| After shares of Gilead Sciences (GILD) peaked on February 6, 2012 (at $56.50), the stock began to progressively trace out a large triangle pattern on its daily chart (Figure 1), one that didn't finally resolve (with a bullish breakout) until July 17, 2012. If you're familiar with the dynamics of chart patterns, then you probably know that a triangle pattern is considered ripe for a decisive breakout attempt once the stock's price bars have traversed at least 75% of the projected apex of the pattern, and in the case of GILD, that's just about the point that the stock decided to launch higher this week. Breakouts are sometimes false, however, and many will return to test the breakout line before proceeding higher (lower); in this case, we see that GILD has had net positive (bullish) long-term money flow (as shown by the 100-period Chaikin money flow [CMF][100] histogram) since late August 2011, and that certainly adds a major bullish tone to this particular breakout. The Raff trading system is one of the MetaStock 11 expert advisors and does a good job of identifying trend-following moves, sometimes during the very early stages of a major move by a given stock. See Figures 1 and 2. |

|
| FIGURE 1: GILD, DAILY. With long-term money flow in a bullish mode for nearly 11 months now, the current bullish breakout in GILD looks like it may have plenty of profit potential. |
| Graphic provided by: MetaStock. |
| |
| Another item of interest here is that the triangle pattern's midpoint (near $50.00) now forms the foundation from which to calculate a projected price target for this nascent breakout. Since the previous major upswing ran from a low of $34.45 (November 21, 2011) to a high of $56.50 (February 6, 2012) -- producing a 22-point gain -- the continuation move higher from the pattern could eventually make it into the mid- to upper $70.00 rang. A more conservative price target might be the mid- to upper $60.00 range, as there will most likely be some pullbacks prior to the stock, adding another 22 points (if it gets that far at all). |

|
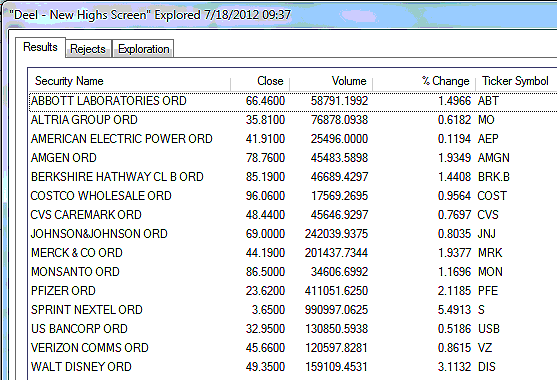
| FIGURE 2: 12-MONTH HIGHS. The .OEX components making new 12-month highs as of July 17, 2012. |
| Graphic provided by: MetaStock. |
| Graphic provided by: MetaStock Explorer. |
| |
| There are two simple ways to play GILD's breakout here: A. If you believe the stock has the ability to run substantially higher on this particular upswing, you might elect to run this as a trend-following play, entering long on a rise above Tuesday's high of $52.98 and then running a 2* ATR(10) volatility trailing stop until you get a daily close below the trail. This might be a good route for aggressive traders to follow, especially with all of the broad stock indexes on track to follow through with more gains as various bullish price cycles drive them higher, or B. If you are more conservative in nature and would rather have the upfront infusion of cash that a covered call will bring into your margin account, then this could also be a great, low-risk way to play GILD now. The August 12 $52.50 calls are going for about $2.13 (which is $213 in cash per contract -- before commissions and slippage -- that goes right into your margin account at the time you sell the call) and has an open interest of 6,629 at this writing. To manage this trade, just go long the stock on a rise above $52.98 and then sell one August 12 $52.50 call for every 100 shares of GILD that you buy. Then use the stock's 21-day exponential moving average (EMA) (blue line on chart) as your trailing stop until the stock is called away, the option expires worthless or the stock makes a daily close below the EMA. |
| However you decide to trade GILD here, make sure that you risk no more than 1% to 2% of your daily account equity, no matter how bullish you might be on GILD at this juncture. |
Donald W. Pendergast is a financial markets consultant who offers specialized services to stock brokers and high net worth individuals who seek a better bottom line for their portfolios.
| Title: | Writer, market consultant |
| Company: | Linear Trading Systems LLC |
| Jacksonville, FL 32217 | |
| Phone # for sales: | 904-239-9564 |
| E-mail address: | lineartradingsys@gmail.com |
Traders' Resource Links | |
| Linear Trading Systems LLC has not added any product or service information to TRADERS' RESOURCE. | |
Click here for more information about our publications!
Comments

Request Information From Our Sponsors
- StockCharts.com, Inc.
- Candle Patterns
- Candlestick Charting Explained
- Intermarket Technical Analysis
- John Murphy on Chart Analysis
- John Murphy's Chart Pattern Recognition
- John Murphy's Market Message
- MurphyExplainsMarketAnalysis-Intermarket Analysis
- MurphyExplainsMarketAnalysis-Visual Analysis
- StockCharts.com
- Technical Analysis of the Financial Markets
- The Visual Investor
- VectorVest, Inc.
- Executive Premier Workshop
- One-Day Options Course
- OptionsPro
- Retirement Income Workshop
- Sure-Fire Trading Systems (VectorVest, Inc.)
- Trading as a Business Workshop
- VectorVest 7 EOD
- VectorVest 7 RealTime/IntraDay
- VectorVest AutoTester
- VectorVest Educational Services
- VectorVest OnLine
- VectorVest Options Analyzer
- VectorVest ProGraphics v6.0
- VectorVest ProTrader 7
- VectorVest RealTime Derby Tool
- VectorVest Simulator
- VectorVest Variator
- VectorVest Watchdog
