HOT TOPICS LIST
- MACD
- Fibonacci
- RSI
- Gann
- ADXR
- Stochastics
- Volume
- Triangles
- Futures
- Cycles
- Volatility
- ZIGZAG
- MESA
- Retracement
- Aroon
INDICATORS LIST
LIST OF TOPICS
PRINT THIS ARTICLE
by Matt Blackman
The technical versus fundamental argument has been around almost as long as the stock markets. But here is a reality that fundamental efficient market hypothesis devotees will be hard pressed to explain.
Position: N/A
Matt Blackman
Matt Blackman is a full-time technical and financial writer and trader. He produces corporate and financial newsletters, and assists clients in getting published in the mainstream media. He is the host of TradeSystemGuru.com. Matt has earned the Chartered Market Technician (CMT) designation. Find out what stocks and futures Matt is watching on Twitter at www.twitter.com/RatioTrade
PRINT THIS ARTICLE
BULL/BEAR MARKET
The Fundamental Disconnect
07/18/12 09:07:05 AMby Matt Blackman
The technical versus fundamental argument has been around almost as long as the stock markets. But here is a reality that fundamental efficient market hypothesis devotees will be hard pressed to explain.
Position: N/A
| In his latest book entitled "Investing In The Second Lost Decade" (McGraw Hill, 2012), veteran trader Martin Pring makes a very good case fthat the current bear market isn't just any bear, it's a secular bear of the real ugly kind, and it's still long from over. Early in the book, Pring takes a not-so-covert but well-constructed shot at fundamental analysis and the efficient market hypothesis: |
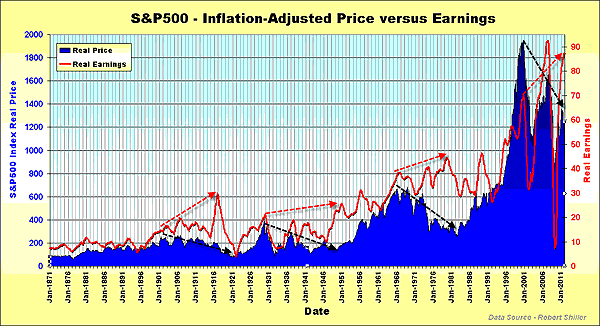
| "If long-term swings in equity prices were driven by the fundamentals then you would expect to see fluctuations in stock prices associated with changes in corporate profitability. Long-term swings in inflation-adjusted profits and equity prices would then be expected to move pretty well in tandem... [The chart below] clearly shows this relationship to be a myth, as profits have actually increased during the three secular bear markets that have occurred since 1900. This is also true of the 21st century...," he proclaims in chapter 3. |
| As Figure 1 of inflation-adjusted Standard & Poor's 500 prices versus earnings clearly shows, there's a loose correlation between earnings and stock prices during secular bull markets, but during secular bears, the price of the S&P 500 becomes completely unglued from earnings. |

|
| FIGURE 1: S&P 500. This chart from Robert Shiller shows what happens during four secular bear markets, including during the latest secular bear market from 2000. The S&P 500 drops in spite of the fact that earnings trend higher. |
| Graphic provided by: Data – Robert Shiller. |
| |
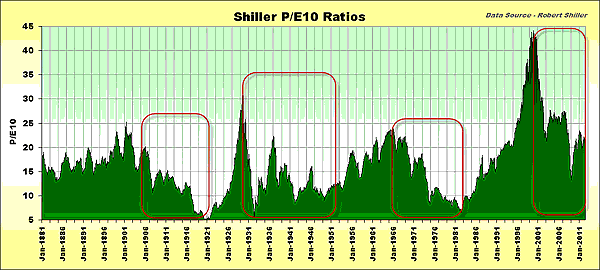
| This relationship is also demonstrated in Figure 2 with the Robert Shiller data of trailing 10-year price/earnings ratio of the S&P 500, which is in effect the relative strength of price versus earnings. During secular bears, P/Es drop as pessimism sets in and takes hold. But as soon as it's over, enthusiasm slowly but surely returns until the P/E peaks and the next secular bear market arrives. This exuberance hit a new all-time high at the end of the Internet bubble and although it had come down from the lofty 44.2 hit in December 1999 to 13.3 by March 2009, that was still more than double the lows of 6.63, 5.6, and 5 hit at the worst of the secular bear market lows in July 1982, June 1932, and August 1920, respectively. |

|
| FIGURE 2: P/E RATIOS. This chart of the Shiller trailing 10-year price/earnings ratio shows the decoupling between stock prices and earnings during secular bear markets. |
| Graphic provided by: Data – Robert Shiller. |
| |
| What is even more interesting is the evidence that Pring presents for significantly lower prices before this secular bear is over, sometime in the next decade or so. It is information that no trader who values his or her portfolio, not to mention self-esteem, should be without. |
Matt Blackman is a full-time technical and financial writer and trader. He produces corporate and financial newsletters, and assists clients in getting published in the mainstream media. He is the host of TradeSystemGuru.com. Matt has earned the Chartered Market Technician (CMT) designation. Find out what stocks and futures Matt is watching on Twitter at www.twitter.com/RatioTrade
| Company: | TradeSystemGuru.com |
| Address: | Box 2589 |
| Garibaldi Highlands, BC Canada | |
| Phone # for sales: | 604-898-9069 |
| Fax: | 604-898-9069 |
| Website: | www.tradesystemguru.com |
| E-mail address: | indextradermb@gmail.com |
Traders' Resource Links | |
| TradeSystemGuru.com has not added any product or service information to TRADERS' RESOURCE. | |
Click here for more information about our publications!
Comments
Date: 08/08/12Rank: 4Comment: Very Interesting

Request Information From Our Sponsors
- StockCharts.com, Inc.
- Candle Patterns
- Candlestick Charting Explained
- Intermarket Technical Analysis
- John Murphy on Chart Analysis
- John Murphy's Chart Pattern Recognition
- John Murphy's Market Message
- MurphyExplainsMarketAnalysis-Intermarket Analysis
- MurphyExplainsMarketAnalysis-Visual Analysis
- StockCharts.com
- Technical Analysis of the Financial Markets
- The Visual Investor
- VectorVest, Inc.
- Executive Premier Workshop
- One-Day Options Course
- OptionsPro
- Retirement Income Workshop
- Sure-Fire Trading Systems (VectorVest, Inc.)
- Trading as a Business Workshop
- VectorVest 7 EOD
- VectorVest 7 RealTime/IntraDay
- VectorVest AutoTester
- VectorVest Educational Services
- VectorVest OnLine
- VectorVest Options Analyzer
- VectorVest ProGraphics v6.0
- VectorVest ProTrader 7
- VectorVest RealTime Derby Tool
- VectorVest Simulator
- VectorVest Variator
- VectorVest Watchdog
