HOT TOPICS LIST
- MACD
- Fibonacci
- RSI
- Gann
- ADXR
- Stochastics
- Volume
- Triangles
- Futures
- Cycles
- Volatility
- ZIGZAG
- MESA
- Retracement
- Aroon
INDICATORS LIST
LIST OF TOPICS
PRINT THIS ARTICLE
by Donald W. Pendergast, Jr.
The .OEX begins to follow through in the wake of last week's bullish reversal.
Position: N/A
Donald W. Pendergast, Jr.
Donald W. Pendergast is a financial markets consultant who offers specialized services to stock brokers and high net worth individuals who seek a better bottom line for their portfolios.
PRINT THIS ARTICLE
TECHNICAL ANALYSIS
PENDY'S PICKS: July 18, 2012
07/18/12 12:28:21 PMby Donald W. Pendergast, Jr.
The .OEX begins to follow through in the wake of last week's bullish reversal.
Position: N/A
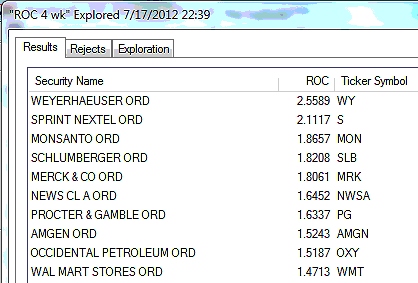
| The .OEX (Standard & Poor's 100) finished Tuesday's trading session at $626.39, rising by 0.73%. The .OEX's rising 34-week, 16-week, and 32-day price cycles are still anticipated to push prices higher in this key large-cap index; the 16-week cycle is the next one due to top, probably sometime around August 1, 2012, give or take a few days, but the 34-week cycle could grind higher until late September or even early October of this year. Figure 1 show us the strongest four-week relative strength (RS) performers in the .OEX. Weyerhaeuser (WY) is still the top dog in this group; if a new home construction rebound is sustainable, the WY's share price should continue to grind higher over time. Procter & Gamble (PG) has reappeared on this top relative strength (RS) list, no doubt because of increased buying speculation because of the actions/intentions of one of its largest shareholders, activist investor Bill Ackman. Not too much change in the rest of the list, except that National Oilwell Varco (NOV) has suddenly disappeared from it! |

|
| FIGURE 1: STRONGEST OEX COMPONENTS. The 10 strongest S&P 100 (.OEX) components over the past month, as of Tuesday, July 17, 2012. |
| Graphic provided by: MetaStock. |
| Graphic provided by: MetaStock Explorer. |
| |
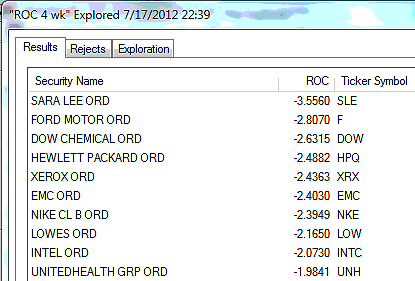
| Figure 2 is a look at the weakest four-week relative strength performers in the .OEX -- Hewlett-Packard (HPQ), Intel (INTC), and EMC Storage (EMC) are still bringing up the rear of the pack, while Sara Lee (SLE) and Ford Motor (F) appear to be near-permanent fixtures at or near the top of the list, no doubt a real favorite with skilled short sellers. Nike (NKE) has been in this weak RS list for weeks but is gradually moving lower, a possible sign of bullish accumulation taking place in the stock. Lowe's (LOW), the giant home improvement chain, is also back in the list, at least until value investors start to view it as a bargain once again. |

|
| FIGURE 2: WEAKEST OEX COMPONENTS. The 10 weakest S&P 100 (.OEX) components over the past month, as of Tuesday, July 17, 2012. |
| Graphic provided by: MetaStock. |
| Graphic provided by: MetaStock Explorer. |
| |
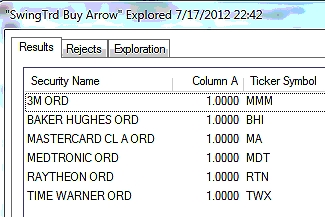
| Figure 3 are the S&P 100 components giving RMO swing buy setup signals; 6% of the .OEX components issued new RMO swing buy signals on Tuesday, with each of the six signals hailing from a different sector and/or industry group -- manufacturing (MMM), oil services (BHI), financial (MA), health (MDT), defense (RTN), and media (TWX). This shows that this is a broad-based rally; a rise above their respective highs made on Tuesday triggers actual long entries. Note that while there were six buy setup signals on Tuesday, there were no sell setup signals at all; this is another hint that the broad market's line of least resistance is still toward higher prices as the 16-week and 34-week cycles in the .OEX help prices grind higher. |

|
| FIGURE 3: SWING BUY SIGNALS. The S&P 100 (.OEX) components issuing RMO swing buy signals at the close of trading on Tuesday, July 17, 2012; 6% of all .OEX components fired buy setup signals during this session, with no new sell setup signals issued. |
| Graphic provided by: MetaStock. |
| Graphic provided by: MetaStock Explorer. |
| |
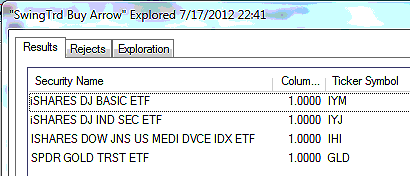
| On the exchange traded funds (ETFs) side of the equation, we have four new buy setup signals to track -- the iShares Basic Materials (IYM), Industrial Sector (IYJ), Medical Devices (IHI), and the SPDRs Gold Trust (GLD) ETFs. Two new swing sell setup signals were fired in the iShares Global Clean Energy (ICLN) and US Natural Gas Fund (UNG) ETF also. The twin combo of the GLD and IYM swing buy setups shouldn't be overlooked, since gold mining stocks certainly make up a nice percentage of IYM's holdings, and that gold mining stocks and the price of gold (as represented by GLD) tend to move in sync a large percentage of the time, with some notable exceptions here and there. See Figure 4. |

|
| FIGURE 4: SWING BUY SIGNALS. Here are the ETFs that fired new RMO swing buy setup signals as of the close of trading on Tuesday, July 17, 2012; there were two RMO swing sell setup signals that also printed at the close of trading on Tuesday. |
| Graphic provided by: MetaStock. |
| Graphic provided by: MetaStock Explorer. |
| |
| Tuesday's bullish follow-through is validating the current cyclical analysis time/price projections for the .OEX. In fact, the minimum price target for the current upswing (that began on June 4, 2012) has just been upped to $648.29, with the maximum target still being $691.19 by no later than October 22, 2012. To repeat previous Pendy Picks' advice to traders: Sticking with the top relative strength stocks and/or those firing mechanical buy signals from proven systems should be your primary focus until the .OEX finally peaks out and starts a significant bearish reversal again. As always, trade wisely until we meet here again. |
Donald W. Pendergast is a financial markets consultant who offers specialized services to stock brokers and high net worth individuals who seek a better bottom line for their portfolios.
| Title: | Writer, market consultant |
| Company: | Linear Trading Systems LLC |
| Jacksonville, FL 32217 | |
| Phone # for sales: | 904-239-9564 |
| E-mail address: | lineartradingsys@gmail.com |
Traders' Resource Links | |
| Linear Trading Systems LLC has not added any product or service information to TRADERS' RESOURCE. | |
Click here for more information about our publications!
PRINT THIS ARTICLE

Request Information From Our Sponsors
- StockCharts.com, Inc.
- Candle Patterns
- Candlestick Charting Explained
- Intermarket Technical Analysis
- John Murphy on Chart Analysis
- John Murphy's Chart Pattern Recognition
- John Murphy's Market Message
- MurphyExplainsMarketAnalysis-Intermarket Analysis
- MurphyExplainsMarketAnalysis-Visual Analysis
- StockCharts.com
- Technical Analysis of the Financial Markets
- The Visual Investor
- VectorVest, Inc.
- Executive Premier Workshop
- One-Day Options Course
- OptionsPro
- Retirement Income Workshop
- Sure-Fire Trading Systems (VectorVest, Inc.)
- Trading as a Business Workshop
- VectorVest 7 EOD
- VectorVest 7 RealTime/IntraDay
- VectorVest AutoTester
- VectorVest Educational Services
- VectorVest OnLine
- VectorVest Options Analyzer
- VectorVest ProGraphics v6.0
- VectorVest ProTrader 7
- VectorVest RealTime Derby Tool
- VectorVest Simulator
- VectorVest Variator
- VectorVest Watchdog
