HOT TOPICS LIST
- MACD
- Fibonacci
- RSI
- Gann
- ADXR
- Stochastics
- Volume
- Triangles
- Futures
- Cycles
- Volatility
- ZIGZAG
- MESA
- Retracement
- Aroon
INDICATORS LIST
LIST OF TOPICS
PRINT THIS ARTICLE
by Donald W. Pendergast, Jr.
Shares of Monsanto are up by more than 90% since July 2010 and are now trading at prices not seen since January 2010. Can this long-term uptrend continue?
Position: N/A
Donald W. Pendergast, Jr.
Donald W. Pendergast is a financial markets consultant who offers specialized services to stock brokers and high net worth individuals who seek a better bottom line for their portfolios.
PRINT THIS ARTICLE
NEW HIGHS-NEW LOWS
Monsanto's 30-Month High
07/19/12 08:45:03 AMby Donald W. Pendergast, Jr.
Shares of Monsanto are up by more than 90% since July 2010 and are now trading at prices not seen since January 2010. Can this long-term uptrend continue?
Position: N/A
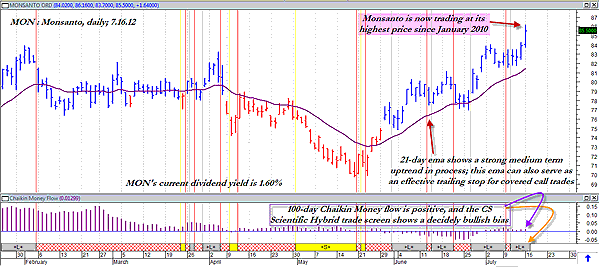
| As anyone who has traded or invested for any length of time knows, the majority of trend moves in a given stock aren't especially smooth or pullback-free and it can be very tough to stay with a long-running trend, particularly if you aren't using a proven mechanical or discretionary method to trade with. As we look at a near-term daily chart of Monsanto (MON), it would be hard to imagine that the stock is in the midst of a two-year uptrend or those who bought in near the July 2010 lows of $44.61 would now be up by more than 91%. Of course, they would have endured numerous pullbacks and small-scale trend reversals along the way and would have had no idea of the steady, solid gains that would be available to the patient trader/investor. Let's face it, there aren't many retail traders who would have stuck with a single stock this long, particularly if they had small accounts with proportionately tiny risk tolerances. However, for those with a basic mechanical swing trading system, the small-term ups and downs and breakouts during the ride from the mid-40s to the mid-80s might very well have been profitable, too. Right now, with MON at a multiyear high and several trend indicators confirming a strong upswing in progress, the question to ask is, "Is this a good time to jump on board the MON bandwagon?" |

|
| FIGURE 1: MON, DAILY. Monsanto shares are enjoying a near-term bull run in the midst of an ongoing, two-year-old uptrend. |
| Graphic provided by: MetaStock. |
| Graphic provided by: CS Scientific expert from MetaStock 11. |
| |
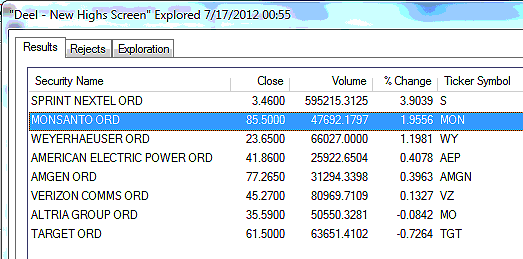
| To answer that question, let's look at several technical measures and also see what the technical state of the broad US markets looks like. First off, MON possesses excellent four-week and 13-week relative strength versus the .OEX, something you always want to see before going long in an already trending issue -- particularly for covered-call traders. Second, the stock has positive long-term money flow (as depicted by the 100-day Chaikin money flow histogram (CMF)(100)), with medium-term money flow (34-day) also in excellent shape. Third, the CS Scientific Hybrid Trade screen expert from MetaStock 11 is confirming a strong bullish uptrend in MON (see the gray ribbon at the bottom of Figure 1). Fourth, the stock is trending above its rising 21-day exponential moving average (EMA). Finally, with the stock making new highs at the same time that all the rest of this is occurring is a very bullish development. And with the stock paying a better than a one-year CD rate of return by way of its 1.6% annual dividend, MON looks to be a prime candidate for a near-term covered-call play. See Figure 2. |

|
| FIGURE 2: LARGE-CAP STOCKS. When shopping for your next covered-call candidate, always check your list of large-cap, dividend-paying stocks for those making new six- or 12-month highs. |
| Graphic provided by: MetaStock. |
| Graphic provided by: Deel New Highs Screen from MetaStock 11. |
| |
| We know that Monsanto shares are enmeshed in a long-term bull market, but since we don't know how long the current upswing will last, the safest way to construct a covered-call trade is to sell one in-the-money August call option for every 100 shares of MON that we own or plan to acquire. The $85.00 August call looks attractive here, since it has the highest open interest of all August calls in MON (4,624 contracts as this is written); daily trading volumes are also very good, too. The $85.00 call has a theta (time decay) value of 0.04, meaning that the call will lose $4 worth of its time premium every day, steadily increasing as the option nears the end of its life on August 18, 2012. So even if MON just treads water and goes sideways for a bit, you'd still be earning open profits through time decay. The call delta is 0.62, which is also a nice asset to any covered-call play; the going price for the call is now $3.40 and if you use the 21-day EMA as the de facto trailing stop on the trade, you'd have about a $3.50 cushion between the current price of the stock and the EMA, making this a very logical strike price/EMA trail combo to use on this very simple and straightforward stock/option trade. Do your own research and see if you don't also agree that this is definitely a near-term covered-call play worth considering. |
Donald W. Pendergast is a financial markets consultant who offers specialized services to stock brokers and high net worth individuals who seek a better bottom line for their portfolios.
| Title: | Writer, market consultant |
| Company: | Linear Trading Systems LLC |
| Jacksonville, FL 32217 | |
| Phone # for sales: | 904-239-9564 |
| E-mail address: | lineartradingsys@gmail.com |
Traders' Resource Links | |
| Linear Trading Systems LLC has not added any product or service information to TRADERS' RESOURCE. | |
Click here for more information about our publications!
PRINT THIS ARTICLE

Request Information From Our Sponsors
- StockCharts.com, Inc.
- Candle Patterns
- Candlestick Charting Explained
- Intermarket Technical Analysis
- John Murphy on Chart Analysis
- John Murphy's Chart Pattern Recognition
- John Murphy's Market Message
- MurphyExplainsMarketAnalysis-Intermarket Analysis
- MurphyExplainsMarketAnalysis-Visual Analysis
- StockCharts.com
- Technical Analysis of the Financial Markets
- The Visual Investor
- VectorVest, Inc.
- Executive Premier Workshop
- One-Day Options Course
- OptionsPro
- Retirement Income Workshop
- Sure-Fire Trading Systems (VectorVest, Inc.)
- Trading as a Business Workshop
- VectorVest 7 EOD
- VectorVest 7 RealTime/IntraDay
- VectorVest AutoTester
- VectorVest Educational Services
- VectorVest OnLine
- VectorVest Options Analyzer
- VectorVest ProGraphics v6.0
- VectorVest ProTrader 7
- VectorVest RealTime Derby Tool
- VectorVest Simulator
- VectorVest Variator
- VectorVest Watchdog
