HOT TOPICS LIST
- MACD
- Fibonacci
- RSI
- Gann
- ADXR
- Stochastics
- Volume
- Triangles
- Futures
- Cycles
- Volatility
- ZIGZAG
- MESA
- Retracement
- Aroon
INDICATORS LIST
LIST OF TOPICS
PRINT THIS ARTICLE
by Donald W. Pendergast, Jr.
After a wide-range reversal day on Friday, Monday's action in the .OEX was rather tame as short-term profit takers held back another daily gain.
Position: N/A
Donald W. Pendergast, Jr.
Donald W. Pendergast is a financial markets consultant who offers specialized services to stock brokers and high net worth individuals who seek a better bottom line for their portfolios.
PRINT THIS ARTICLE
TECHNICAL ANALYSIS
PENDY'S PICKS: July 17, 2012
07/17/12 09:00:18 AMby Donald W. Pendergast, Jr.
After a wide-range reversal day on Friday, Monday's action in the .OEX was rather tame as short-term profit takers held back another daily gain.
Position: N/A
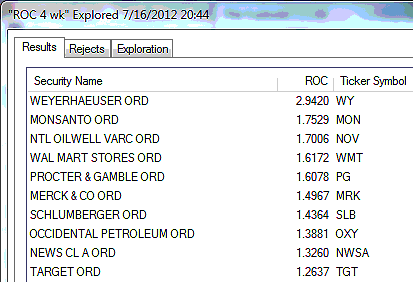
| The .OEX (Standard & Poor's 100) finished Monday's trading session at 621.83, shedding only one point after its strong bullish reversal on Friday. The .OEX's rising 34-week, 16-week, and 32-day price cycles are still projecting plenty more upside in this key large-cap index; the action during Tuesday's trading session should quickly resolve any questions regarding the next sustained direction for this index and for its close cousin, the .SPX. Figure 1 shows us the strongest four-week relative strength (RS) performers in the .OEX. Weyerhaeuser (WY) is still holding the top ranking; of real interest, however, is the sudden appearance of two key oil service group stocks, National Oilwell Varco (NOV) and Schlumberger (SLB), along with oil exploration/production giant Occidental Petroleum (OXY). Clearly, the oil sector stocks are back on the stove, with the burners going full blast. A move of crude oil back above $90 would also be an added incentive for these stocks' share prices to rise even further in the weeks ahead. |

|
| FIGURE 1: STRONGEST COMPONENTS. The 10 strongest S&P 100 (.OEX) components over the past month, as of Monday, July 16, 2012. |
| Graphic provided by: MetaStock. |
| Graphic provided by: MetaStock Explorer. |
| |
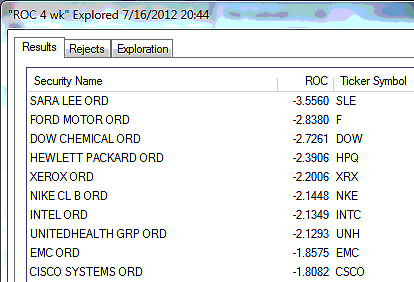
| Figure 2 is a look at the weakest four-week relative strength performers in the .OEX Hewlett-Packard (HPQ), Intel (INTC), EMC Storage (EMC), and Cisco Systems (CSCO) are the tech-themed stocks in the weak RS part of town, and it appears that the big sector rotation theme right now is that of "sell techs and buy oils/oil services." Sara Lee (SLE) and Ford Motor (F) remain stuck at or near the top of the list, confirming their long running bear trends, with Dow Chemical (DOW) and Nike (NKE) also continuing to lag the broad market over the past month. |

|
| FIGURE 2: WEAKEST COMPONENTS. The 10 weakest S&P 100 (.OEX) components over the past month, as of Monday, July 16, 2012. |
| Graphic provided by: MetaStock. |
| Graphic provided by: MetaStock Explorer. |
| |
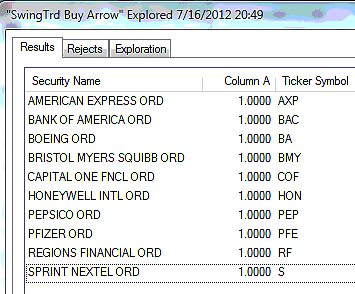
| Figure 3 are the S&P 100 components, giving RMO swing buy setup signals; 10% of the .OEX components issued new RMO swing buy signals on Monday. Four of the signals are from the financial sector stocks, names like Bank of America (BAC), Capital One Financial (COF), and Regions Financial (RF); a rise above their respective highs made on Monday triggers actual long entries. In addition, be on the lookout for shares of JPMorgan (JPM) to start rising once again; a break above 36.20 triggers a long entry in this stock. Note that while there were 10 buy setup signals on Monday, there were no sell setup signals at all; this is another hint that the broad market's path of least resistance is toward higher prices. |

|
| FIGURE 3: SWING BUY SIGNALS. The S&P 100 (.OEX) components issuing RMO swing buy signals at the close of trading on Monday, July 16, 2012; 10% of all .OEX components fired buy setup signals during this session, with no new sell setup signals issued. |
| Graphic provided by: MetaStock. |
| Graphic provided by: MetaStock Explorer. |
| |
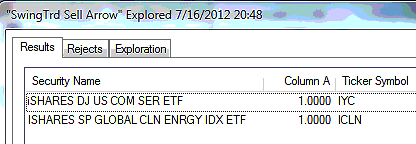
| On the exchange traded funds (ETFs) side of the equation, we have two new sell setup signals to track -- the iShares Consumer Services (IYC) and Global Clean Energy (ICLN) ETFs. A new swing buy setup signal was fired in the iShares Aerospace and Defense (ITA) ETF as well. If the setup in ITA actually triggers a buy on a rise above its Monday high of 62.82, it will add extra credibility to the currently bullish cycle projections in the .OEX, since defense names are a significant industry group. The defense/aerospace industries are also heavily reliant on equipment made by a myriad of technology firms, so a rally in ITA might just help give a boost to some of the weak tech giants share prices. See Figure 4. |

|
| FIGURE 4: SWING SELL SIGNALS. The ETFs that fired new RMO swing sell setup signals as of the close of trading on Monday, July 16, 2012. There was one RMO swing buy setup signal that also printed at the close of trading on Monday. |
| Graphic provided by: MetaStock. |
| Graphic provided by: MetaStock Explorer. |
| |
| Despite a momentary pause in the anticipated upward trajectory of the .OEX, the bullish 34-week and 16-week cycles are still ruling the roost among the large-cap stocks in this key index. In fact, the minimum price target for the current upswing (that began on June 4, 2012) is 641.22, with the maximum target still being 691.19. Sticking with the top relative strength stocks and/or those firing mechanical buy signals from proven systems should be your primary focus until the .OEX finally peaks out and starts a significant bearish reversal again. As always, trade wisely until we meet here again. |
Donald W. Pendergast is a financial markets consultant who offers specialized services to stock brokers and high net worth individuals who seek a better bottom line for their portfolios.
| Title: | Writer, market consultant |
| Company: | Linear Trading Systems LLC |
| Jacksonville, FL 32217 | |
| Phone # for sales: | 904-239-9564 |
| E-mail address: | lineartradingsys@gmail.com |
Traders' Resource Links | |
| Linear Trading Systems LLC has not added any product or service information to TRADERS' RESOURCE. | |
Click here for more information about our publications!
PRINT THIS ARTICLE

|

Request Information From Our Sponsors
- StockCharts.com, Inc.
- Candle Patterns
- Candlestick Charting Explained
- Intermarket Technical Analysis
- John Murphy on Chart Analysis
- John Murphy's Chart Pattern Recognition
- John Murphy's Market Message
- MurphyExplainsMarketAnalysis-Intermarket Analysis
- MurphyExplainsMarketAnalysis-Visual Analysis
- StockCharts.com
- Technical Analysis of the Financial Markets
- The Visual Investor
- VectorVest, Inc.
- Executive Premier Workshop
- One-Day Options Course
- OptionsPro
- Retirement Income Workshop
- Sure-Fire Trading Systems (VectorVest, Inc.)
- Trading as a Business Workshop
- VectorVest 7 EOD
- VectorVest 7 RealTime/IntraDay
- VectorVest AutoTester
- VectorVest Educational Services
- VectorVest OnLine
- VectorVest Options Analyzer
- VectorVest ProGraphics v6.0
- VectorVest ProTrader 7
- VectorVest RealTime Derby Tool
- VectorVest Simulator
- VectorVest Variator
- VectorVest Watchdog
