HOT TOPICS LIST
- MACD
- Fibonacci
- RSI
- Gann
- ADXR
- Stochastics
- Volume
- Triangles
- Futures
- Cycles
- Volatility
- ZIGZAG
- MESA
- Retracement
- Aroon
INDICATORS LIST
LIST OF TOPICS
PRINT THIS ARTICLE
by Chaitali Mohile
Aruba Networks has plunged below the important support levels.
Position: Hold
Chaitali Mohile
Active trader in the Indian stock markets since 2003 and a full-time writer. Trading is largely based upon technical analysis.
PRINT THIS ARTICLE
TECHNICAL ANALYSIS
Aruba Networks Remains Favorite Stock
07/16/12 12:08:08 PMby Chaitali Mohile
Aruba Networks has plunged below the important support levels.
Position: Hold
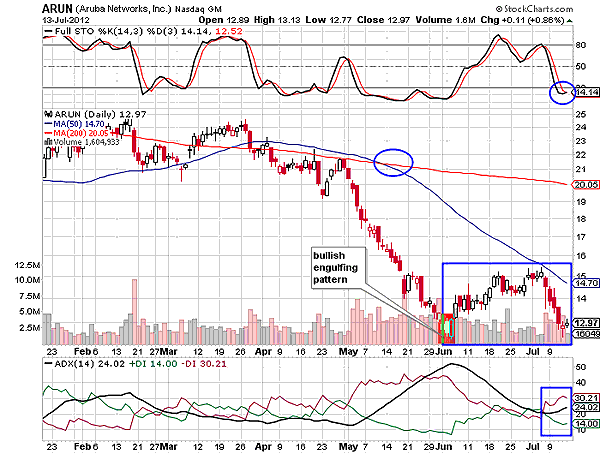
| Aruba Networks (ARUN) is in a long-term downtrend. In such scenarios, any intermediate pullbacks could whipsaw new long positions. These small rallies in a downtrend are unlikely to sustain and traders who think of them as trend reversals get washed away. ARUN underwent a vertical price fall, losing more than $10 within a short time span. Since March 2012 to June 2012, the stock plunged about $10 from the top, breaching the 50-day as well as the 200-day moving average (MA) support. Later, the two moving averages underwent a bearish crossover (Figure 1), highlighting bearish signals. |

|
| FIGURE 1: ARUN, DAILY |
| Graphic provided by: StockCharts.com. |
| |
| The full stochastic (14,3,3) rallied within the oversold region. It failed to surge above the 50 levels, suggesting weak momentum. A downtrend was developed after converting the two moving averages' support to resistance. Later, as the stock rushed below $12, both indicators turned extremely bearish, suggesting a trend reversal rally. Accordingly, ARUN established support at $12.50 and formed a bullish engulfing pattern to reconfirm the pullback rally. The price recovered from the bottom but could not climb to higher levels. Thus, ARUN took a U-turn and retraced back to its previous support at $12.50. The stock formed an inverted bowl at the bottom of the rally, suggesting more downside. |
| During this bowl formation process, the declining downtrend regained its strength and surged above the 20 levels. An oversold stochastic oscillator is tipped upward; hence, it can initiate a small pullback. However, the 50-day MA resistance in Figure 1 would stop the upward price movement, forcing the stock to resume its bearish action. |

|
| FIGURE 2: ARUN, WEEKLY |
| Graphic provided by: StockCharts.com. |
| |
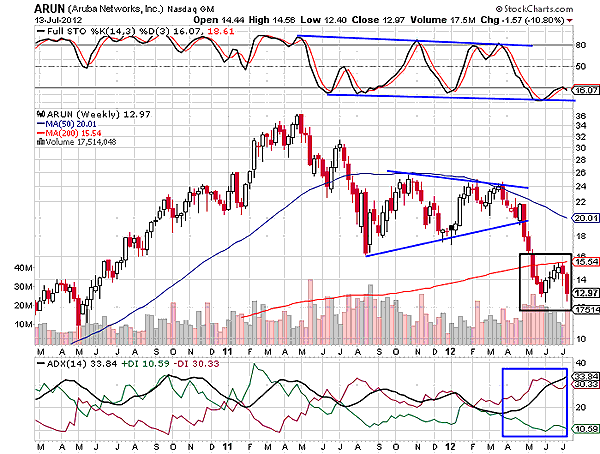
| According to the weekly chart in Figure 2, ARUN has been in bearish mood since 2011. The stock formed a top in May 2011, beginning a descending rally that later turned into a robust correction. Gradually, ARUN plunged below the 50-day MA. Here, the stock formed a symmetrical triangular pattern, which broke downward. Although this pattern can break in any direction, the strong bearish pressure in ARUN forced the pattern to break down. Eventually, the bearish rally continued. The long red candles in Figure 2 show the bearish strength in the stock. Later, the 200-day MA support was also breached, suggesting a major bearish breakout. |
| Currently, ARUN is rallying below the newly formed 200-day MA resistance. An inverted bowl is formed in Figure 2 as well. The average directional index (ADX) (14) on the weekly chart is indicating the well-developed and steady downtrend. The momentum oscillator is likely to drift down in an oversold region. In such a scenario, the stock would continue its bearish journey till it reaches its previous low at $10. Traders who have short positions in ARUN can continue their bearish ride with the nearest price target at $10. |
Active trader in the Indian stock markets since 2003 and a full-time writer. Trading is largely based upon technical analysis.
| Company: | Independent |
| Address: | C1/3 Parth Indraprasth Towers. Vastrapur |
| Ahmedabad, Guj 380015 | |
| E-mail address: | chaitalimohile@yahoo.co.in |
Traders' Resource Links | |
| Independent has not added any product or service information to TRADERS' RESOURCE. | |
Click here for more information about our publications!
PRINT THIS ARTICLE

Request Information From Our Sponsors
- StockCharts.com, Inc.
- Candle Patterns
- Candlestick Charting Explained
- Intermarket Technical Analysis
- John Murphy on Chart Analysis
- John Murphy's Chart Pattern Recognition
- John Murphy's Market Message
- MurphyExplainsMarketAnalysis-Intermarket Analysis
- MurphyExplainsMarketAnalysis-Visual Analysis
- StockCharts.com
- Technical Analysis of the Financial Markets
- The Visual Investor
- VectorVest, Inc.
- Executive Premier Workshop
- One-Day Options Course
- OptionsPro
- Retirement Income Workshop
- Sure-Fire Trading Systems (VectorVest, Inc.)
- Trading as a Business Workshop
- VectorVest 7 EOD
- VectorVest 7 RealTime/IntraDay
- VectorVest AutoTester
- VectorVest Educational Services
- VectorVest OnLine
- VectorVest Options Analyzer
- VectorVest ProGraphics v6.0
- VectorVest ProTrader 7
- VectorVest RealTime Derby Tool
- VectorVest Simulator
- VectorVest Variator
- VectorVest Watchdog
