HOT TOPICS LIST
- MACD
- Fibonacci
- RSI
- Gann
- ADXR
- Stochastics
- Volume
- Triangles
- Futures
- Cycles
- Volatility
- ZIGZAG
- MESA
- Retracement
- Aroon
INDICATORS LIST
LIST OF TOPICS
PRINT THIS ARTICLE
by Donald W. Pendergast, Jr.
After experiencing a sharp decline earlier this year, shares of JPMorganChase appear to be on the verge of making up even more of those losses.
Position: N/A
Donald W. Pendergast, Jr.
Donald W. Pendergast is a financial markets consultant who offers specialized services to stock brokers and high net worth individuals who seek a better bottom line for their portfolios.
PRINT THIS ARTICLE
TECHNICAL ANALYSIS
JPMorganChase Bullish Reversal Takes Root
07/18/12 08:31:10 AMby Donald W. Pendergast, Jr.
After experiencing a sharp decline earlier this year, shares of JPMorganChase appear to be on the verge of making up even more of those losses.
Position: N/A
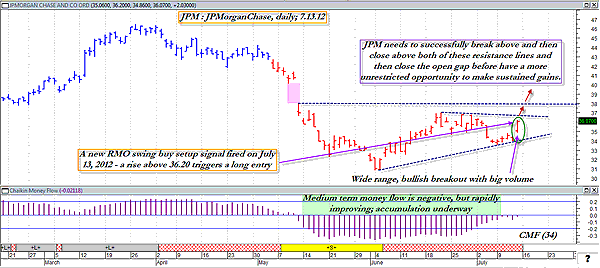
| May 2012 was not kind to long-term investors in JPMorganChase (JPM) as the firm revealed that massive trading losses -- amounting to approximately $2 billion -- had been incurred by several of their in-house traders. The market punished the company's share price mercilessly, driving it from $44.24 on May 1, 2012, to $30.83 on June 4, 2012 -- a plunge of more than 30% in just six weeks. Strangely enough, the stock managed to bottom and then reverse, reaching higher even as the company revised the amount of its estimated trading losses up by several billion dollars, with current estimates something more like $6 billion to $9 billion! Here's a look at an interesting buy opportunity in this large cap banking giant's shares now. See Figure 1. |

|
| FIGURE 1: JPM, DAILY. With multiple bullish price cycles driving the .OEX higher now, JPM should have little difficulty in meeting or even exceeding the twin resistance lines depicted in the next week or two, if not sooner. |
| Graphic provided by: MetaStock. |
| Graphic provided by: CS Scientific expert from MetaStock 11. |
| |
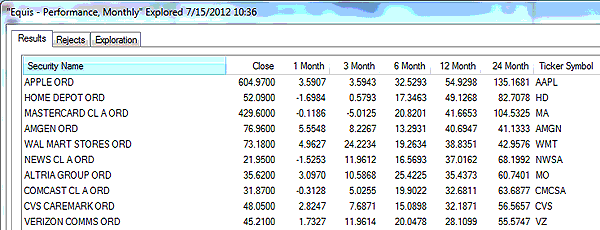
| Fundamentals surely do matter when it comes to valuing a given stock at any given time. At least that's how the theory goes, but in the case of JPM, that apparently doesn't make a hill of beans worth of difference to those who have been busy accumulating JPM shares since it bottomed out on June 4, 2012. Perhaps it's the smart money bunch hard at work again, so sure they are that JPM will come through this mess, make up the trading losses and get back to business as usual, because the stock is up by nearly 17% since early last month. Based on the 34-period Chaikin money flow histogram (CMF)(34), strong accumulation has been under way since the third week of June 2012, and with Friday's powerful, wide-range, high-volume bullish breakout, the stock is now in a prime position to stage a two-phase bullish breakout (see dashed resistance lines on the chart), one that could lead the way toward closure of the massive open gap of mid-May 2012. A rise and daily close above $37.03 will also confirm the stock's uptrend (higher swing highs and higher swing lows) on its daily chart, another exceedingly bullish factor to watch for. Several other banking giants also fired swing buy setup signals on Friday, July 13, such as Morgan Stanley (MS) and Bank of New York Mellon (BK), so if you see JPM rise above $36.20, MS rise above $14.10, and BK rise above $21.79 in the next couple of trading sessions, you can be pretty sure that the financial stocks are going to enjoy a solid, tradable swing move higher in the near term. With powerful, bullish price cycles in the Standard & Poor's 100 (.OEX) set to pull the index to higher levels, JPM and the entire banking industry group should be the prime beneficiaries of such a rise. See Figure 2. |

|
| FIGURE 2: OEX COMPONENTS. The .OEX components ranked highest in terms of their most recent 12-month performance. |
| Graphic provided by: MetaStock. |
| Graphic provided by: MetaStock Explorer. |
| |
| Playing JPM here is simple and straightforward: 1. Buy on a break above $36.20, setting an initial stop at $33.90 2. Run a two-bar trailing stop of the daily lows 3. If $37.99 is approached quickly, consider taking at least half of your open position off, since that is the lower range of the open gap and is likely to act as a strong resistance area the first time it's hit 4. Simply continue to trail that balance of the position with the two-bar trail of the daily lows until the final stopout. Covered-call traders could simply buy on a break above $36.20 and then run a 21-day exponential moving average (EMA) as their own trailing stop until final closeout of the trade. Using slightly in-the-money calls with less than six to eight weeks of remaining time value is best in most covered-call setups, depending on your personal level of bullishness in a given stock. Either way you choose to trade JPM, the probabilities are excellent for some more bullish follow-through in the weeks ahead. |
Donald W. Pendergast is a financial markets consultant who offers specialized services to stock brokers and high net worth individuals who seek a better bottom line for their portfolios.
| Title: | Writer, market consultant |
| Company: | Linear Trading Systems LLC |
| Jacksonville, FL 32217 | |
| Phone # for sales: | 904-239-9564 |
| E-mail address: | lineartradingsys@gmail.com |
Traders' Resource Links | |
| Linear Trading Systems LLC has not added any product or service information to TRADERS' RESOURCE. | |
Click here for more information about our publications!
PRINT THIS ARTICLE

Request Information From Our Sponsors
- VectorVest, Inc.
- Executive Premier Workshop
- One-Day Options Course
- OptionsPro
- Retirement Income Workshop
- Sure-Fire Trading Systems (VectorVest, Inc.)
- Trading as a Business Workshop
- VectorVest 7 EOD
- VectorVest 7 RealTime/IntraDay
- VectorVest AutoTester
- VectorVest Educational Services
- VectorVest OnLine
- VectorVest Options Analyzer
- VectorVest ProGraphics v6.0
- VectorVest ProTrader 7
- VectorVest RealTime Derby Tool
- VectorVest Simulator
- VectorVest Variator
- VectorVest Watchdog
- StockCharts.com, Inc.
- Candle Patterns
- Candlestick Charting Explained
- Intermarket Technical Analysis
- John Murphy on Chart Analysis
- John Murphy's Chart Pattern Recognition
- John Murphy's Market Message
- MurphyExplainsMarketAnalysis-Intermarket Analysis
- MurphyExplainsMarketAnalysis-Visual Analysis
- StockCharts.com
- Technical Analysis of the Financial Markets
- The Visual Investor
