HOT TOPICS LIST
- MACD
- Fibonacci
- RSI
- Gann
- ADXR
- Stochastics
- Volume
- Triangles
- Futures
- Cycles
- Volatility
- ZIGZAG
- MESA
- Retracement
- Aroon
INDICATORS LIST
LIST OF TOPICS
PRINT THIS ARTICLE
by Andrew Hetherington
A look at Gateway Inc. and Apple Computer Corporation brings up the question, is a weak sector getting weaker?
Position: N/A
Andrew Hetherington
Classic Dow Theorist who trades as a pure technician, using pattern recognition.
PRINT THIS ARTICLE
CHART ANALYSIS
Triangles and Fan Lines: Are All the Box Makers Heading Lower?
06/25/02 10:53:30 AMby Andrew Hetherington
A look at Gateway Inc. and Apple Computer Corporation brings up the question, is a weak sector getting weaker?
Position: N/A
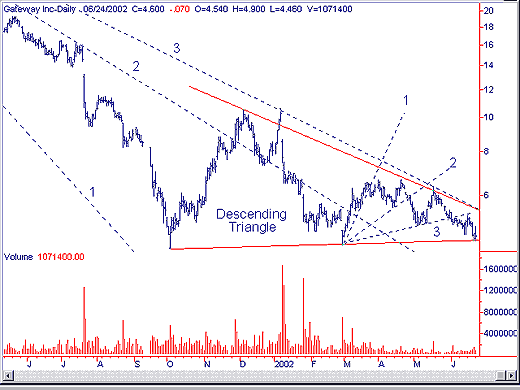
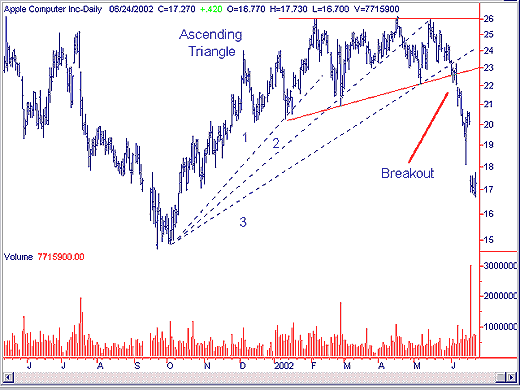
  Graphic provided by SuperCharts The above daily charts for Gateway Inc. (GTW) and Apple Computer Corporation (AAPL) show that these two box makers are headed lower or have already been punished. It will come as no surprise to anyone that the sector is in trouble as many have been discussing. IBM, Dell, Gateway, Apple and Hewlett-Packard are all weak. What does this say about the other related technology equities such as Intel or Microsoft? Who knows? However, this sector is weak and heading lower. |
| The daily chart for Gateway has an 8-month descending triangle with good volume on the creation of the pattern. It broke the very small third fan line on the downside, but more importantly, it could not break topside of the third fan line to change direction from down to up. The top line of the triangle is in the $5.50 area and this is a good bail out area if you are long or a good area to sell it short within the pattern. The bottom line on the triangle is in the $4.50 area to confirm the pattern. |
| In the case of Apple, the worst is temporarily over. Now it is time to retrace a little. However, this equity is still in trouble and will likely reach the September low of $14.68 eventually. This pullback is a good time to sell your long positions if you have a short-term time horizon. In addition, I would not sell this equity short in this situation since it has already reacted by dropping from $26.00 to $18.00. |
Classic Dow Theorist who trades as a pure technician, using pattern recognition.
| Toronto, Canada |
Click here for more information about our publications!
Comments
Date: 06/25/02Rank: 5Comment:
Date: 07/02/02Rank: 4Comment:
Date: 07/02/02Rank: 4Comment:

Request Information From Our Sponsors
- VectorVest, Inc.
- Executive Premier Workshop
- One-Day Options Course
- OptionsPro
- Retirement Income Workshop
- Sure-Fire Trading Systems (VectorVest, Inc.)
- Trading as a Business Workshop
- VectorVest 7 EOD
- VectorVest 7 RealTime/IntraDay
- VectorVest AutoTester
- VectorVest Educational Services
- VectorVest OnLine
- VectorVest Options Analyzer
- VectorVest ProGraphics v6.0
- VectorVest ProTrader 7
- VectorVest RealTime Derby Tool
- VectorVest Simulator
- VectorVest Variator
- VectorVest Watchdog
- StockCharts.com, Inc.
- Candle Patterns
- Candlestick Charting Explained
- Intermarket Technical Analysis
- John Murphy on Chart Analysis
- John Murphy's Chart Pattern Recognition
- John Murphy's Market Message
- MurphyExplainsMarketAnalysis-Intermarket Analysis
- MurphyExplainsMarketAnalysis-Visual Analysis
- StockCharts.com
- Technical Analysis of the Financial Markets
- The Visual Investor
