HOT TOPICS LIST
- MACD
- Fibonacci
- RSI
- Gann
- ADXR
- Stochastics
- Volume
- Triangles
- Futures
- Cycles
- Volatility
- ZIGZAG
- MESA
- Retracement
- Aroon
INDICATORS LIST
LIST OF TOPICS
PRINT THIS ARTICLE
by Donald W. Pendergast, Jr.
With the 610.00/611.00 support holding up, which way now for the .OEX?
Position: N/A
Donald W. Pendergast, Jr.
Donald W. Pendergast is a financial markets consultant who offers specialized services to stock brokers and high net worth individuals who seek a better bottom line for their portfolios.
PRINT THIS ARTICLE
TECHNICAL ANALYSIS
PENDY'S PICKS: July 13, 2012
07/13/12 08:36:33 AMby Donald W. Pendergast, Jr.
With the 610.00/611.00 support holding up, which way now for the .OEX?
Position: N/A
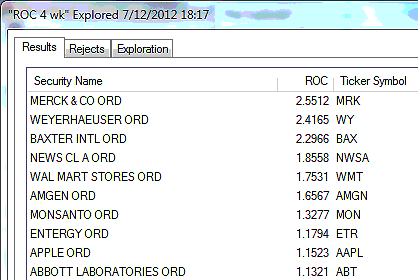
| The .OEX (Standard & Poor's 100) finished Thursday's trading session at 612.65, once again testing/retesting the critical Fibonacci support confluence zone of 610.00/611.00. Actually, the index dropped slightly below that level, hitting 609.03 as an intraday low before rebounding and closing higher. Now, the big question is this: Has a swing low been finally made, and if so, is this the time to start going long again? One logical way to know if 609.03 was the low is if we see a daily close above 624.16 (Tuesday's high), as this would be like seeing a short trade close out Friday on a violation of a three-bar trailing stop of the daily highs. This would seem to be convincing evidence that the market had intentions of a tradable swing move toward higher prices. More aggressive traders could even use Wednesday's high of 617.05 or Thursday's high of 615.63 as their long entry confirmation triggers. Figure 1 shows us the strongest four-week relative strength (RS) performers in the .OEX. Not too much change to report here; health sector names are still ranking high in RS, including Baxter International (BAX), Amgen (AMGN), Abbott Labs (ABT), and Merck (MRK), which is the new leader of the pack versus the .OEX over the past month. Health sector stocks are definitely in on Wall Street, it would seem -- at least this week. NewsCorp (NWSA) continues to fade in terms of bullish four-week RS, but is still strong in absolute terms. |

|
| FIGURE 1: STRONGEST COMPONENTS. The 10 strongest S&P 100 (.OEX) components over the past month, as of Thursday, July 12, 2012. |
| Graphic provided by: MetaStock. |
| Graphic provided by: MetaStock Explorer. |
| |
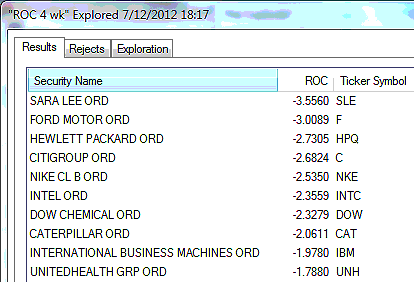
| Figure 2 is a look at the weakest four-week relative strength performers in the .OEX; this particular list is looking a bit stale -- the same big names appear to be stuck in a rut. Nike (NKE), Sara Lee (SLE), Ford Motor (F), and Hewlett-Packard (HPQ) remain in early summer slumps; Dupont (DD), Dow Chemical (DOW), Intel (INTC), and International Business Machines (IBM) continue to fall out of favor with medium-term investors. As mentioned in yesterday's Pendy's Picks, most if not all of these stocks should experience tradable bounces if the anticipated reversal higher (from the 610.00/611.00 area) in the .OEX commences soon. |

|
| FIGURE 2: WEAKEST COMPONENTS. The 10 weakest S&P 100 (.OEX) components over the past month, as of Thursday, July 12, 2012. |
| Graphic provided by: MetaStock. |
| Graphic provided by: MetaStock Explorer. |
| |
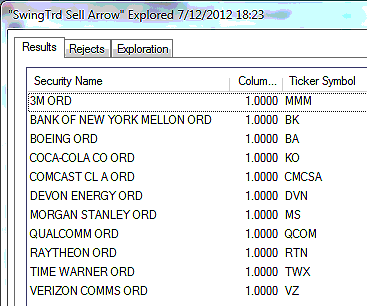
| Figure 3 are the S&P 100 components giving Rahul Mohindar (RMO) swing sell signals; 11% of the .OEX components issued new RMO swing sell signals on Thursday. There were no new RMO buy signals in .OEX components on Thursday. As mentioned in the previous two editions of Pendy's Picks, if only a fraction of these stocks actually trigger a short entry, it will be a very good indication that the broad market intends to bottom and turn back higher as the dominant (and bullish) higher-degree cycles begin to exert control once again. See Figure 4. Of these 11 stocks, there aren't an inordinate number of them from any particular group or sector -- this has been an equal opportunity, short-term selloff in the broad US markets. Friday's market action should prove to be very interesting, as a break above (below) the daily high (low) in the .OEX is sure to unleash some pentup buying (selling) pressure. Keep a close watch on the .OEX and .SPX on Friday, especially if you already have open positions in the market, as both indexes will trigger short RMO entries on a drop below 609.03 in the .OEX and 1325.41 in the .SPX. |

|
| FIGURE 3: RMO SWING SELL SIGNALS. The S&P 100 (.OEX) components issuing RMO swing sell signals at the close of trading on Thursday, July 12, 2012; 11% of all .OEX components fired sell signals during this session, with no new buy signals issued. |
| Graphic provided by: MetaStock. |
| Graphic provided by: MetaStock Explorer. |
| |
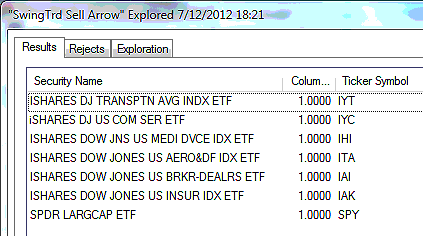
| In the world of exchange traded funds (ETFs), we have seven new short sales to be aware of -- the iShares Consumer Services (IYC), Medical Devices (IHI), Transportation (IYT), Aerospace and Defense (ITA), Broker Dealers (IAI), Insurance Index (IAK), and SPDRS Large Cap (SPY) ETFs will trigger new short entries on a drop below their respective Thursday lows. There was one new buy signal, the iShares Utilities (IDU) ETF. |

|
| FIGURE 4: ETFs FIRING NEW SELL SIGNALS. The ETFs that fired new RMO swing sell signals as of the close of trading on Thursday, July 12, 2012. There was one RMO swing buy signal that also printed at the close on Thursday. |
| Graphic provided by: MetaStock. |
| Graphic provided by: MetaStock Explorer. |
| |
| The trading action on Friday the 13th could be some of the most exciting seen in a while, as the .OEX and .SPX are now at or near critical make-or-break junctures. If either index can manage a daily close above Wednesday or Thursday's high, the probabilities are high of continued bullish follow-through. However, if both of these large-cap indexes drop below their lows of Thursday, expect either a quick "wash and rinse" maneuver -- one designed to lure overconfident bears into the trap just before the smart money starts buying like crazy -- or expect to see some heavy, committed selling throughout the session, with 600.00 being the next real support level in the .OEX. Trade wisely until we meet here again. |
Donald W. Pendergast is a financial markets consultant who offers specialized services to stock brokers and high net worth individuals who seek a better bottom line for their portfolios.
| Title: | Writer, market consultant |
| Company: | Linear Trading Systems LLC |
| Jacksonville, FL 32217 | |
| Phone # for sales: | 904-239-9564 |
| E-mail address: | lineartradingsys@gmail.com |
Traders' Resource Links | |
| Linear Trading Systems LLC has not added any product or service information to TRADERS' RESOURCE. | |
Click here for more information about our publications!
PRINT THIS ARTICLE

Request Information From Our Sponsors
- StockCharts.com, Inc.
- Candle Patterns
- Candlestick Charting Explained
- Intermarket Technical Analysis
- John Murphy on Chart Analysis
- John Murphy's Chart Pattern Recognition
- John Murphy's Market Message
- MurphyExplainsMarketAnalysis-Intermarket Analysis
- MurphyExplainsMarketAnalysis-Visual Analysis
- StockCharts.com
- Technical Analysis of the Financial Markets
- The Visual Investor
- VectorVest, Inc.
- Executive Premier Workshop
- One-Day Options Course
- OptionsPro
- Retirement Income Workshop
- Sure-Fire Trading Systems (VectorVest, Inc.)
- Trading as a Business Workshop
- VectorVest 7 EOD
- VectorVest 7 RealTime/IntraDay
- VectorVest AutoTester
- VectorVest Educational Services
- VectorVest OnLine
- VectorVest Options Analyzer
- VectorVest ProGraphics v6.0
- VectorVest ProTrader 7
- VectorVest RealTime Derby Tool
- VectorVest Simulator
- VectorVest Variator
- VectorVest Watchdog
