HOT TOPICS LIST
- MACD
- Fibonacci
- RSI
- Gann
- ADXR
- Stochastics
- Volume
- Triangles
- Futures
- Cycles
- Volatility
- ZIGZAG
- MESA
- Retracement
- Aroon
INDICATORS LIST
LIST OF TOPICS
PRINT THIS ARTICLE
by Chaitali Mohile
A bearish breakout of Ford Motor would initiate a new downtrend.
Position: Sell
Chaitali Mohile
Active trader in the Indian stock markets since 2003 and a full-time writer. Trading is largely based upon technical analysis.
PRINT THIS ARTICLE
HEAD & SHOULDERS
Ford In Fresh Downtrend
07/12/12 12:24:56 PMby Chaitali Mohile
A bearish breakout of Ford Motor would initiate a new downtrend.
Position: Sell
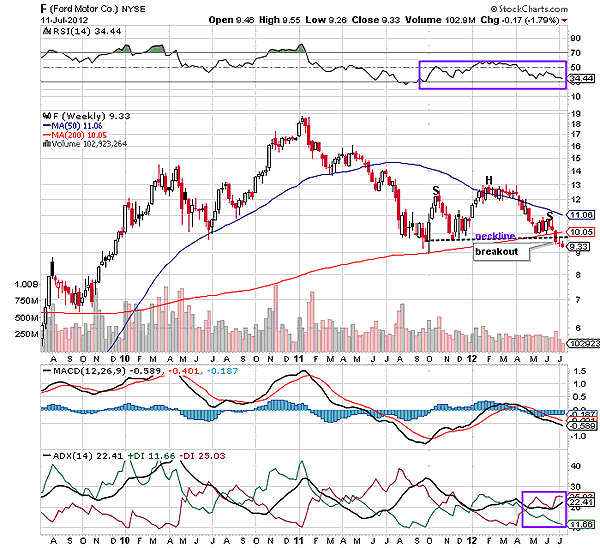
| Ford Motor (F) has formed a head & shoulders pattern at the bottom of a descending rally on the weekly time frame chart (Figure 1). This pattern is considered as a major trend reversal pattern when it appears at the top of the rally. A bearish breakout of this pattern gives birth to a new downtrend, terminating the bullish force in the stock/index. However, the average directional index (ADX) (14) was very jittery. Neither of the two trends could sustain for a longer period. |
| Earlier, an uptrend helped F to climb with the support of the 50-day moving average (MA). But the trend indicator lowered as the rally formed a top at $19. Thereafter, the declining rally witnessed huge selling as well as buying pressure, resulting in an unstable trend. After breaching the 50-day MA support, the bears turned stronger and captured the trend. F had already moved in a downtrend before forming the head & shoulders formation. |

|
| FIGURE 1: F, WEEKLY |
| Graphic provided by: StockCharts.com. |
| |
| Hence, we will consider the H&S as a continuation pattern (consolidation) that will resume the existing rally after the breakout. The important point to watch is a bearish breakout of the 200-day moving average (MA) support along with the neckline support of the pattern. This breakout would add to the bearish confidence, strengthening the developing downtrend in Figure 1. The relative strength index (RSI) (14) is also descending, and the moving average convergence/divergence (MACD)(12,26,9) is suggesting bearish momentum in the rally. Therefore, the downward breakout of the head & shoulder continuation pattern and the 200-day MA would result in major damage for the stock. However, it would be the best buying opportunity for short-selling traders. |

|
| FIGURE 2: F, MONTHLY |
| Graphic provided by: StockCharts.com. |
| |
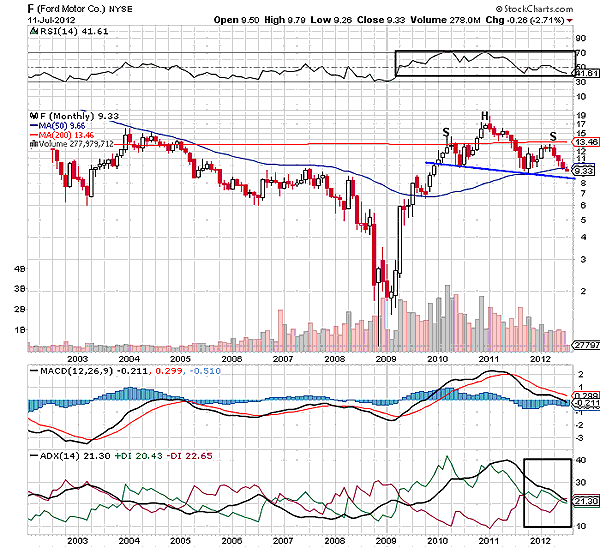
| In Figure 2, the monthly chart, F has formed a head & shoulders pattern, a bearish trend reversal formation under the resistance of the 200-day MA. Since the pattern formed at the top of the previous bullish rally, a bearish breakout of the pattern would initiate a fresh long downtrend for the stock. The declining neckline support shows bearish strength. Here, the 50-day MA support is coinciding with the neckline support. Therefore, the bearish breakout would lead to a major correction in F. |
| The potential target for the head & shoulders is measured by subtracting the length of the head from the neckline level. Here, the length of the head is 19 - 8.5 = 10.5, thus 10.5 - 8 (breakout point) = 1.5 is the minimum estimated level for F. The bearish breakout would reverse the previous declining uptrend and develop a fresh downtrend for the stock. The RSI (14) has formed lower highs, indicating increasing bearish force. The moving average convergence/divergence (MACD)(12, 26,9) is negative and is ready to plunge in negative territory. Thus, all the conditions are favorable for the bearish breakout. To conclude, the head & shoulder bearish breakout would begin the fresh downtrend for F. |
Active trader in the Indian stock markets since 2003 and a full-time writer. Trading is largely based upon technical analysis.
| Company: | Independent |
| Address: | C1/3 Parth Indraprasth Towers. Vastrapur |
| Ahmedabad, Guj 380015 | |
| E-mail address: | chaitalimohile@yahoo.co.in |
Traders' Resource Links | |
| Independent has not added any product or service information to TRADERS' RESOURCE. | |
Click here for more information about our publications!
PRINT THIS ARTICLE

Request Information From Our Sponsors
- StockCharts.com, Inc.
- Candle Patterns
- Candlestick Charting Explained
- Intermarket Technical Analysis
- John Murphy on Chart Analysis
- John Murphy's Chart Pattern Recognition
- John Murphy's Market Message
- MurphyExplainsMarketAnalysis-Intermarket Analysis
- MurphyExplainsMarketAnalysis-Visual Analysis
- StockCharts.com
- Technical Analysis of the Financial Markets
- The Visual Investor
- VectorVest, Inc.
- Executive Premier Workshop
- One-Day Options Course
- OptionsPro
- Retirement Income Workshop
- Sure-Fire Trading Systems (VectorVest, Inc.)
- Trading as a Business Workshop
- VectorVest 7 EOD
- VectorVest 7 RealTime/IntraDay
- VectorVest AutoTester
- VectorVest Educational Services
- VectorVest OnLine
- VectorVest Options Analyzer
- VectorVest ProGraphics v6.0
- VectorVest ProTrader 7
- VectorVest RealTime Derby Tool
- VectorVest Simulator
- VectorVest Variator
- VectorVest Watchdog
