HOT TOPICS LIST
- MACD
- Fibonacci
- RSI
- Gann
- ADXR
- Stochastics
- Volume
- Triangles
- Futures
- Cycles
- Volatility
- ZIGZAG
- MESA
- Retracement
- Aroon
INDICATORS LIST
LIST OF TOPICS
PRINT THIS ARTICLE
by Donald W. Pendergast, Jr.
With support at 618.00 having failed, the .OEX may now test the 610.00 area before turning higher.
Position: N/A
Donald W. Pendergast, Jr.
Donald W. Pendergast is a financial markets consultant who offers specialized services to stock brokers and high net worth individuals who seek a better bottom line for their portfolios.
PRINT THIS ARTICLE
TECHNICAL ANALYSIS
PENDY'S PICKS: July 11, 2012
07/11/12 09:29:33 AMby Donald W. Pendergast, Jr.
With support at 618.00 having failed, the .OEX may now test the 610.00 area before turning higher.
Position: N/A
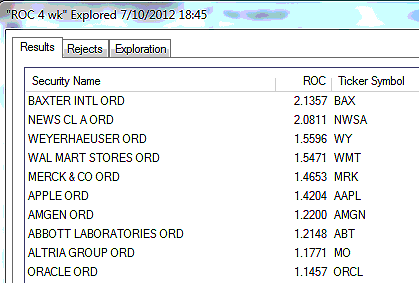
| The .OEX (Standard & Poor's 100) pulled back some more during Tuesday's trading session, shedding 0.72% in the process (closing at 615.76). With the 618.00 Fibonacci confluence support level now being violated, a further drop toward 610.00 to 611.00 looks probable, now that the 61-day cycle in the .OEX is falling. However, the 32-day, 16-week, and 34-week cycles are all rising, which suggests that any further weakness in the large-cap US stock indexes is going to be of limited duration and will do little if any more real technical damage before the market starts on an unexpected summer rally. Baxter International (BAX), Abbott Labs (ABT), Amgen (AMGN), and Merck (MRK) are four giant health-sector stocks leading the relative strength (RS) parade among big caps, with some of these names already at or near new six- and/or 12-month highs. Again, this definitely confirms a major rotation into the big pharma names in the .OEX and .SPX and is a likely low-risk place to deploy funds for the time being. Covered calls might be the most conservative way to seek profits in these names at this point. Meanwhile, Monsanto (MON) has dropped from the top 10 RS list, replaced by Altria Group (MO). See Figure 1. |

|
| FIGURE 1: STRONGEST 10. The 10 strongest S&P 100 (.OEX) components over the past month, as of Tuesday, July 10, 2012. |
| Graphic provided by: MetaStock. |
| Graphic provided by: MetaStock Explorer. |
| |
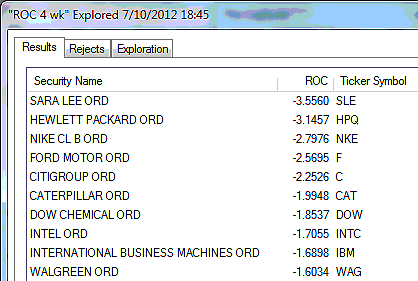
| Figure 2 is a look at the weakest four-week relative strength performers in the .OEX; there isn't much in the way of day-to-day change here, either. Nike (NKE), Sara Lee (SLE), Ford Motor (F), Hewlett-Packard (HPQ), and Walgreen's (WAG) are still severely lagging the broad markets, as are DuPont (DD), Dow Chemical (DOW), Intel (INTC), and International Business Machines (IBM). |

|
| FIGURE 2: WEAKEST 10. The 10 weakest S&P 100 (.OEX) components over the past month, as of Tuesday, July 10, 2012. |
| Graphic provided by: MetaStock. |
| Graphic provided by: MetaStock Explorer. |
| |
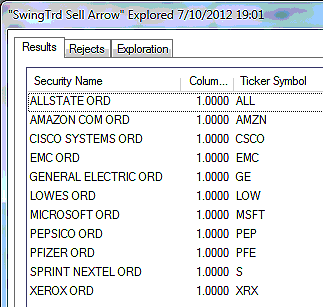
| Figure 3 are the S&P 100 components giving RMO swing sell signals; 11% of the .OEX components issued new RMO swing sell signals on Tuesday, which is bearish -- but only if the majority of these sell setups actually trigger short entries on a drop below their respective lows made on Tuesday. There was one new RMO buy signal, that being in shares of Target (TGT). The sell signals emanate from the tech sector (MSFT, CSCO, EMC, XRX), financial sector (ALL), retail groups (AMZN, LOW), telecom group (S), and pharma group (PFE) along with General Electric (GE) and PepsiCo (PEP). If only a fraction of these stocks actually trigger a short entry, it will be a very good indication that the broad market intends to soon bottom and turn back higher as the dominant (and bullish) higher-degree cycles begin to exert control once again. |

|
| FIGURE 3: RMO SWING SELL SIGNALS. The S&P 100 (.OEX) components issuing RMO swing sell signals at the close of trading on Tuesday, July 10, 2012; 11% of all .OEX components fired sell signals during this session, with only one new buy signal issued. |
| Graphic provided by: MetaStock. |
| Graphic provided by: Metastock's Explorer. |
| |
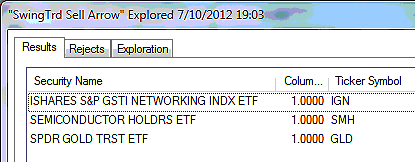
| In the world of exchange traded funds (ETFs), we have three new short sales to consider: the iShares Networking (IGN), Semiconductor HOLDRs (SMH), and SPDRS Gold Trust (GLD) will trigger new short entries on a drop below Tuesday's lows (Figure 4). Even though the price of gold and gold stocks don't always move in lockstep, you might still be shorting some of the individual gold stocks that are also flashing new sell signals, since GDX (the Market Vector Gold Miners ETF) fell significantly today, taking out a near-term support level. |

|
| FIGURE 4: ETFs. The ETFs that fired new RMO swing sell signals as of the close of trading on Tuesday, July 10, 2012. |
| Graphic provided by: MetaStock. |
| Graphic provided by: MetaStock Explorer. |
| |
| A big turn may be imminent in the .OEX; look for 610 to 611 to hold back further selling and for the market to begin to rise again by the end of this week's trading action. Again, the major clue that a reversal is near is if less than half of today's 11 sell signals actually trigger new short entries this week. Trade wisely until we meet here again. |
Donald W. Pendergast is a financial markets consultant who offers specialized services to stock brokers and high net worth individuals who seek a better bottom line for their portfolios.
| Title: | Writer, market consultant |
| Company: | Linear Trading Systems LLC |
| Jacksonville, FL 32217 | |
| Phone # for sales: | 904-239-9564 |
| E-mail address: | lineartradingsys@gmail.com |
Traders' Resource Links | |
| Linear Trading Systems LLC has not added any product or service information to TRADERS' RESOURCE. | |
Click here for more information about our publications!
PRINT THIS ARTICLE

|

Request Information From Our Sponsors
- StockCharts.com, Inc.
- Candle Patterns
- Candlestick Charting Explained
- Intermarket Technical Analysis
- John Murphy on Chart Analysis
- John Murphy's Chart Pattern Recognition
- John Murphy's Market Message
- MurphyExplainsMarketAnalysis-Intermarket Analysis
- MurphyExplainsMarketAnalysis-Visual Analysis
- StockCharts.com
- Technical Analysis of the Financial Markets
- The Visual Investor
- VectorVest, Inc.
- Executive Premier Workshop
- One-Day Options Course
- OptionsPro
- Retirement Income Workshop
- Sure-Fire Trading Systems (VectorVest, Inc.)
- Trading as a Business Workshop
- VectorVest 7 EOD
- VectorVest 7 RealTime/IntraDay
- VectorVest AutoTester
- VectorVest Educational Services
- VectorVest OnLine
- VectorVest Options Analyzer
- VectorVest ProGraphics v6.0
- VectorVest ProTrader 7
- VectorVest RealTime Derby Tool
- VectorVest Simulator
- VectorVest Variator
- VectorVest Watchdog
