

HOT TOPICS LIST
- MACD
- Fibonacci
- RSI
- Gann
- ADXR
- Stochastics
- Volume
- Triangles
- Futures
- Cycles
- Volatility
- ZIGZAG
- MESA
- Retracement
- Aroon
INDICATORS LIST
LIST OF TOPICS
PRINT THIS ARTICLE
by Koos van der Merwe
On June 25, I wrote that we should look at Netflix as a possible buy. Now may be that time.
Position: Accumulate
Koos van der Merwe
Has been a technical analyst since 1969, and has worked as a futures and options trader with First Financial Futures in Johannesburg, South Africa.
PRINT THIS ARTICLE
GAPS
Is It Time For Netflix?
07/11/12 09:24:04 AMby Koos van der Merwe
On June 25, I wrote that we should look at Netflix as a possible buy. Now may be that time.
Position: Accumulate
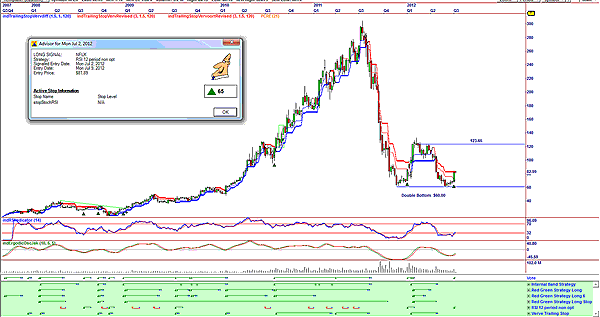
| On June 25, I wrote that Netflix (NFLX) had formed a double bottom, suggesting that we should only consider buying should the price break above $106.83. That, along with the relative strength index (RSI) rising and the JM internal band indicator suggesting a buy should the price break above the upper band at $70.24, made this stock look interesting indeed. My charts have now given me a definite buy signal. |
|
| FIGURE 1: NFLX, WEEKLY |
| Graphic provided by: OmniTrader. |
| |
| Figure 1 is a weekly chart that has given a buy signal in the vote line. The advisor rating for Monday, July 2, is 65, with an entry date of July 9 at $81.89. The buy signal was triggered by the relative strength index (RSI) 12-period nonoptimized strategy. The chart is also suggesting a double bottom forming at the $60 level, with an immediate target of $123.65. On June 25, the share price came to my attention when its price began to test the upper JM internal band line. At that time, I concluded that we should only consider buying should the price break above the $106.83 level. That and a move above the upper JM internal band line at $70.24 should also be a positive. The weekly chart has now confirmed a buy signal. |
|
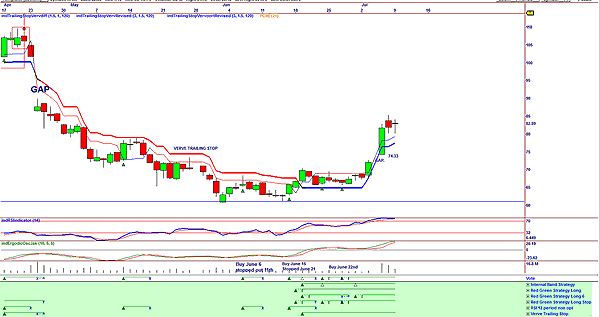
| FIGURE 2: NFLX, DAILY |
| Graphic provided by: OmniTrader. |
| |
| Figure 2 is a daily chart that shows that a buy signal was given by the RSI 12-period strategy on June 6, which was stopped out on June 11. A new buy signal was given on June 15 once again by the RSI 12-period strategy, which was later confirmed by a number of red-green strategies. Once more it was stopped out by the RSI 12-period strategy on June 21, but the summation of the red-green strategies gave a vote line buy signal on June 22 that is still in force. The chart is showing the 14-period RSI is at overbought levels, with the ergodic oscillator also above the zero line, but not yet suggesting a sell. With the gap at the $74.33 level, I would wait for a correction to fill the gap before buying, anticipating a share rise to fill the gap that occurred in April. I would be a buyer of NFLX on any correction. |
Has been a technical analyst since 1969, and has worked as a futures and options trader with First Financial Futures in Johannesburg, South Africa.
| Address: | 3256 West 24th Ave |
| Vancouver, BC | |
| Phone # for sales: | 6042634214 |
| E-mail address: | petroosp@gmail.com |
Click here for more information about our publications!
PRINT THIS ARTICLE

Request Information From Our Sponsors
- StockCharts.com, Inc.
- Candle Patterns
- Candlestick Charting Explained
- Intermarket Technical Analysis
- John Murphy on Chart Analysis
- John Murphy's Chart Pattern Recognition
- John Murphy's Market Message
- MurphyExplainsMarketAnalysis-Intermarket Analysis
- MurphyExplainsMarketAnalysis-Visual Analysis
- StockCharts.com
- Technical Analysis of the Financial Markets
- The Visual Investor
- VectorVest, Inc.
- Executive Premier Workshop
- One-Day Options Course
- OptionsPro
- Retirement Income Workshop
- Sure-Fire Trading Systems (VectorVest, Inc.)
- Trading as a Business Workshop
- VectorVest 7 EOD
- VectorVest 7 RealTime/IntraDay
- VectorVest AutoTester
- VectorVest Educational Services
- VectorVest OnLine
- VectorVest Options Analyzer
- VectorVest ProGraphics v6.0
- VectorVest ProTrader 7
- VectorVest RealTime Derby Tool
- VectorVest Simulator
- VectorVest Variator
- VectorVest Watchdog