HOT TOPICS LIST
- MACD
- Fibonacci
- RSI
- Gann
- ADXR
- Stochastics
- Volume
- Triangles
- Futures
- Cycles
- Volatility
- ZIGZAG
- MESA
- Retracement
- Aroon
INDICATORS LIST
LIST OF TOPICS
PRINT THIS ARTICLE
by Donald W. Pendergast, Jr.
After breaking free from a long-running trading range, shares of Merck and Co. have gone on to make a new high.
Position: N/A
Donald W. Pendergast, Jr.
Donald W. Pendergast is a financial markets consultant who offers specialized services to stock brokers and high net worth individuals who seek a better bottom line for their portfolios.
PRINT THIS ARTICLE
NEW HIGHS-NEW LOWS
A Covered-Call Play For MRK?
07/12/12 08:52:08 AMby Donald W. Pendergast, Jr.
After breaking free from a long-running trading range, shares of Merck and Co. have gone on to make a new high.
Position: N/A
| The Deel New High Screen exploration in MetaStock 11 is one of the best screening tools available when it comes time to look for attractive covered-call plays, especially in large, dividend-paying stocks. Here's a look at how to locate such stocks, using their daily charts and other tools to determine which ones offer the lowest risk and highest probability of producing profits. |

|
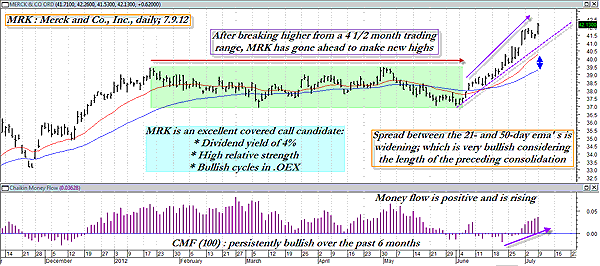
| FIGURE 1: MRK, DAILY. The swing traders had many potentially profitable, tradable moves from January through May 2012; now it may be the trend-following crowd's turn to make money. |
| Graphic provided by: MetaStock. |
| |
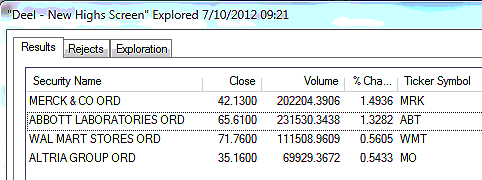
| Merck (MRK) shares rebounded steadily after making a cycle low in late November 2011, making steady bullish headway until mid-January 2012. The gains weren't spectacular, but for a heavily traded, lumbering big-cap issue, it was pretty impressive, nonetheless. Then MRK went into a very defined, narrow-range, four and a half month-long period of sideways action (green shaded on Figure 1) that was a short-term swing trader's dream. MRK bounced between $36.91 and $39.50 on successive swings during that 19-week period, unable to trend strongly for any length of time. That is, until June 21, 2012; that's when MRK finally broke free, when its upward momentum was enough to attract even more buying power. MRK managed to make it to $42.26 on July 9, 2012, making a new high in the process (Figure 2). Since stocks trading at new highs are always a great place to start the search for low-risk covered-call candidates, let's use this simple chart example in MRK to illustrate how a covered-call trader might analyze this or any other new-high stock: 1. Run either the Standard & Poor's 100 (.OEX) or S&P 500 (.SPX) stocks through a screening process to locate the ones making new six- or 12-month highs. 2. Focus on the ones that are outperforming their parent index over the most recent four- and 13-week periods. 3. Out of these stocks, do some research and determine which ones have positive earnings growth rates for the next six to 12 months. 4. Finally, examine the daily (or even weekly) charts of the stocks that pass all of these screening criteria. You should favor those stocks that have already broken out of defined trading ranges or those that are already in steady uptrends (higher swing highs and higher swing lows). |

|
| FIGURE 2: OEX. The four .OEX components that passed the Deel New Highs Screen exploration at the close of trading on July 9, 2012. |
| Graphic provided by: MetaStock. |
| Graphic provided by: Deel New Highs Screen from MetaStock 11. |
| |
| Granted, you're not going to be able to locate stocks like this every day, but when you do, your odds of covered-call success with stocks exhibiting these characteristics should be greatly improved. One you have the stock you desire to sell calls against, the rest of your job is very straightforward: 1. Sell calls with three to six weeks of remaining time value. 2. Sell only those calls with excellent open interest and daily volume figures. 3. The deltas should be at least 0.50 (at the money), but deltas closer to 0.60 or 0.70 (in the money) may help give you a little more cushion against an adverse move. Once you've put the position on (remember a covered call position is 100 shares of long stock combined with one short call in the same stock), managing it is also simple: 1. Plot a 21-day exponential moving average (EMA) on the stock's chart and monitor it every day. This "line in the sand" will serve as your trailing stop for the life of the trade. 2. Alternatively, you can also run a trendline along the bottom of previous swing lows and then extend the line forward in time. This trendline can also be used as a de facto trailing stop for your covered-call position. Choose the trailing stop that will give your covered-call position a bit of room to back and fill so that you don't get stopped out prematurely. This is a subjective issue, but the more experience you have as a trader, the easier it will be to determine which trail is best for you to use on your covered-call trades. |
Donald W. Pendergast is a financial markets consultant who offers specialized services to stock brokers and high net worth individuals who seek a better bottom line for their portfolios.
| Title: | Writer, market consultant |
| Company: | Linear Trading Systems LLC |
| Jacksonville, FL 32217 | |
| Phone # for sales: | 904-239-9564 |
| E-mail address: | lineartradingsys@gmail.com |
Traders' Resource Links | |
| Linear Trading Systems LLC has not added any product or service information to TRADERS' RESOURCE. | |
Click here for more information about our publications!
Comments

Request Information From Our Sponsors
- StockCharts.com, Inc.
- Candle Patterns
- Candlestick Charting Explained
- Intermarket Technical Analysis
- John Murphy on Chart Analysis
- John Murphy's Chart Pattern Recognition
- John Murphy's Market Message
- MurphyExplainsMarketAnalysis-Intermarket Analysis
- MurphyExplainsMarketAnalysis-Visual Analysis
- StockCharts.com
- Technical Analysis of the Financial Markets
- The Visual Investor
- VectorVest, Inc.
- Executive Premier Workshop
- One-Day Options Course
- OptionsPro
- Retirement Income Workshop
- Sure-Fire Trading Systems (VectorVest, Inc.)
- Trading as a Business Workshop
- VectorVest 7 EOD
- VectorVest 7 RealTime/IntraDay
- VectorVest AutoTester
- VectorVest Educational Services
- VectorVest OnLine
- VectorVest Options Analyzer
- VectorVest ProGraphics v6.0
- VectorVest ProTrader 7
- VectorVest RealTime Derby Tool
- VectorVest Simulator
- VectorVest Variator
- VectorVest Watchdog
