HOT TOPICS LIST
- MACD
- Fibonacci
- RSI
- Gann
- ADXR
- Stochastics
- Volume
- Triangles
- Futures
- Cycles
- Volatility
- ZIGZAG
- MESA
- Retracement
- Aroon
INDICATORS LIST
LIST OF TOPICS
PRINT THIS ARTICLE
by Donald W. Pendergast, Jr.
The .OEX barely moves at all during the first trading session of the week.
Position: N/A
Donald W. Pendergast, Jr.
Donald W. Pendergast is a financial markets consultant who offers specialized services to stock brokers and high net worth individuals who seek a better bottom line for their portfolios.
PRINT THIS ARTICLE
TECHNICAL ANALYSIS
PENDY'S PICKS: July 10, 2012
07/10/12 08:30:53 AMby Donald W. Pendergast, Jr.
The .OEX barely moves at all during the first trading session of the week.
Position: N/A
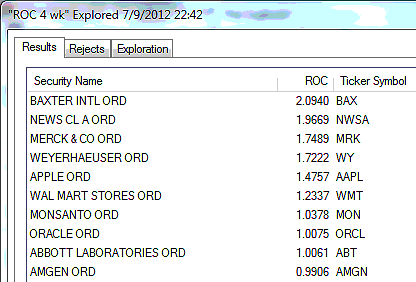
| The .OEX (Standard & Poor's 100) barely moved at all during the first trading session of the week (closing at 620.19). Days like this are a drag for traders who want action, but you simply can't make the market "do" anything; wise traders and investors already know that sticking with a well-founded trading plan and patiently waiting for each valid signal from their systems is the only reliable way to consistently take profits out of the markets. Since the higher-degree cycles in the .OEX still suggest more upside, waiting for new, valid buy signals is the only sane course of action. Figure 1 is a look at the strongest four-week relative strength performers in the .OEX. NewsCorp (NWSA) is still highly ranked, but Sprint Nextel (S) has completely vanished from the top 10 list. Baxter International (BAX) has shot right to the top of the list, even as Abbott Labs (ABT) joins the party. This definitely confirms a major rotation into the big pharma names in the .OEX and .SPX and is an investment/trading theme to watch in upcoming sessions. Apple (AAPL) and Monsanto (MON) are two new additions to the list that are worth watching, too. |

|
| FIGURE 1: STRONGEST OEX.The 10 strongest S&P 100 (.OEX) components over the past month, as of Monday, July 9, 2012. |
| Graphic provided by: MetaStock. |
| Graphic provided by: MetaStock Explorer. |
| |
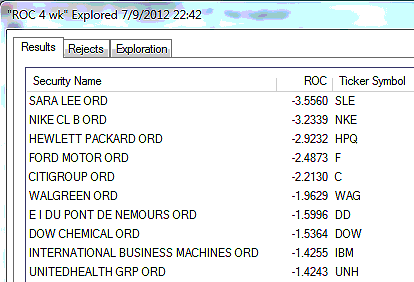
| Figure 2 is a look at the weakest four-week relative strength performers in the .OEX; not much change at all here -- Nike (NKE), Sara Lee (SLE), Ford Motor (F), Hewlett-Packard (HPQ), and Walgreen's (WAG) all continue to underperform, as are Dupont (DD), Dow Chemical (DOW), International Business Machines (IBM), and United Health Group (UNH). Did you know that using the four- and 13-week relative strength rankings together can give you a broader picture of the sector rotations going on in the .OEX (or virtually any stock index)? Try this approach to market analysis if this is of interest to you; one way to use it might be to use the four-week relative strength (RS) output to help plan short-term swing trades and the longer 13-week RS output to help guide you into trend-following situations. |

|
| FIGURE 2: WEAKEST OEX. The 10 weakest S&P 100 (.OEX) components over the past month, as of Monday, July 9, 2012. |
| Graphic provided by: MetaStock. |
| Graphic provided by: MetaStock Explorer. |
| |
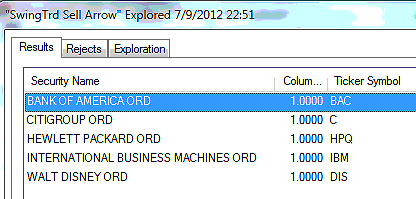
| Figure 3 are the S&P 100 components giving RMO swing sell signals; 5% of the .OEX components issued new RMO swing sell signals on Monday and there were no new RMO buy signals at all. The inclusion of Bank of America (BAC) and Citigroup (C) suggest that the financial sector stocks may have a bit more downside before the .OEX decides to get back into the long-term bullish groove. Each of the stocks listed triggers an actual short entry on a drop below their respective Monday lows. |

|
| FIGURE 3: RMO SWING SELL SIGNALS. The S&P 100 (.OEX) components issuing RMO swing sell signals at the close of trading on Monday, July 9, 2012; 5% of all .OEX components fired sell signals during this session, with no new buy signals issued. |
| Graphic provided by: MetaStock. |
| Graphic provided by: MetaStock Explorer. |
| |
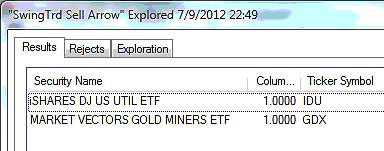
| As far as exchange traded funds (ETFs) go, well, we have two new short sales to consider -- the Market Vectors Gold Miners (GDX) and the iShares Utilities (IDU) ETFs. As with stock signals, these too will trigger new short entries on a drop below Monday's lows. Consider shorting some of the individual gold stocks that have the poorest earnings growth projections if you are willing to accept a larger risk/reward factor than by simply shorting GDX. |

|
| FIGURE 4: ETFS. The ETFs that fired new RMO swing sell signals as of the close of trading on Monday, July 9, 2012. |
| Graphic provided by: MetaStock. |
| Graphic provided by: MetaStock Explorer. |
| |
| Despite the "do-nothing" kind of market action in the .OEX today, the recent forecast for the .OEX to find support near either 618.00 or 611.00 levels remains unchanged. With higher-degree cycles still pointing higher in the .OEX, these support areas could trigger the next wave of powerful bullish reversals that may very well take the index up toward 643.29 or higher between now and early October 2012. Trade wisely until we meet here again. |
Donald W. Pendergast is a financial markets consultant who offers specialized services to stock brokers and high net worth individuals who seek a better bottom line for their portfolios.
| Title: | Writer, market consultant |
| Company: | Linear Trading Systems LLC |
| Jacksonville, FL 32217 | |
| Phone # for sales: | 904-239-9564 |
| E-mail address: | lineartradingsys@gmail.com |
Traders' Resource Links | |
| Linear Trading Systems LLC has not added any product or service information to TRADERS' RESOURCE. | |
Click here for more information about our publications!
PRINT THIS ARTICLE

Request Information From Our Sponsors
- StockCharts.com, Inc.
- Candle Patterns
- Candlestick Charting Explained
- Intermarket Technical Analysis
- John Murphy on Chart Analysis
- John Murphy's Chart Pattern Recognition
- John Murphy's Market Message
- MurphyExplainsMarketAnalysis-Intermarket Analysis
- MurphyExplainsMarketAnalysis-Visual Analysis
- StockCharts.com
- Technical Analysis of the Financial Markets
- The Visual Investor
- VectorVest, Inc.
- Executive Premier Workshop
- One-Day Options Course
- OptionsPro
- Retirement Income Workshop
- Sure-Fire Trading Systems (VectorVest, Inc.)
- Trading as a Business Workshop
- VectorVest 7 EOD
- VectorVest 7 RealTime/IntraDay
- VectorVest AutoTester
- VectorVest Educational Services
- VectorVest OnLine
- VectorVest Options Analyzer
- VectorVest ProGraphics v6.0
- VectorVest ProTrader 7
- VectorVest RealTime Derby Tool
- VectorVest Simulator
- VectorVest Variator
- VectorVest Watchdog
