HOT TOPICS LIST
- MACD
- Fibonacci
- RSI
- Gann
- ADXR
- Stochastics
- Volume
- Triangles
- Futures
- Cycles
- Volatility
- ZIGZAG
- MESA
- Retracement
- Aroon
INDICATORS LIST
LIST OF TOPICS
PRINT THIS ARTICLE
by Donald W. Pendergast, Jr.
The 13-week relative strength of major ETFs versus the broad stock indexes reveals some interesting dynamics at work.
Position: N/A
Donald W. Pendergast, Jr.
Donald W. Pendergast is a financial markets consultant who offers specialized services to stock brokers and high net worth individuals who seek a better bottom line for their portfolios.
PRINT THIS ARTICLE
TECHNICAL ANALYSIS
Analyzing Stocks In Strong ETFs
07/11/12 09:20:47 AMby Donald W. Pendergast, Jr.
The 13-week relative strength of major ETFs versus the broad stock indexes reveals some interesting dynamics at work.
Position: N/A
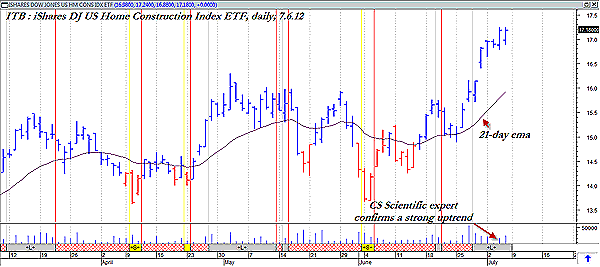
| For much of the past five years, investors have been painfully aware of the weakness in the US housing market; the market carnage caused by the mortgage and banking crises took a toll not only on housing values but also on the portfolios of those who were overly exposed to the stocks in this formerly high-flying industry group. Times, however, can and do change. Housing values have begun to stabilize in a variety of metro areas, and new home construction is also beginning to increase, albeit from very depressed levels. The stocks in the home construction industry (iShares exchange traded fund: ITB) have been doing nicely over the past calendar quarter, especially when compared to the performance of the Standard & Poor's 100 (.OEX) over the same time span. Looking at the daily chart of ITB (Figure 1), we find that it has gained a lot of ground since coming out of the early June 2012 low and is now trading back above $17.00 per share. More important, the CS Scientific Hybrid Trade Screen from MetaStock 11 has also confirmed the bullish strength, as the gray ribbon at the bottom of the chart depicts. Your homework is to analyze the charts of the following stocks, all of which are from the home construction industry: -Toll Brothers Inc. (TOLL) -Beazer Homes (BZH) -Lennar Corp. (LEN) -DR Horton (DHI) -Hovnanian Enterprises (HOV) -KB Home (KBH) -Meritage Homes Corp. (MTH) -Pulte Homes, Inc. (PHM) -The Ryland Group, Inc. (RYL) As you analyze each stock, look for the following qualities: 1. Its projected earnings growth rate for the next six to 12 months. Look for those stocks in which this all-important fundamental is moving steadily higher, as the stock price should ratchet higher with each new positive earnings growth rate revision. 2. Look for the stocks that are flashing mechanical buy signals from proven trading systems. MetaStock 11 has many excellent trading systems and related explorations already installed; you may find just the right one for your trading style as you become more familiar with that particular program. 3. Look for stocks that are beginning to break higher from well-defined consolidation ranges in conjunction with the mechanical trading system buy signal of your choice. |

|
| FIGURE 1: ITB, DAILY. Trading high-relative strength ETFs is fine, but savvy traders know that bigger returns are sometimes possible by trading the strongest component stocks held by such bullishly trending ETFs. |
| Graphic provided by: MetaStock. |
| Graphic provided by: CS Scientific expert from MetaStock 11. |
| |
| Once you find stocks meeting this criteria (by the way, this simple screening method can be applied to any stocks from any outperforming industry group ETF), you need to keep your account risk at 1% to 2% maximum per trade and also need to manage the trade wisely until the final stopout. You can use a simple moving average as a trailing stop -- maybe a five-period exponential moving average (EMA) for a short-term swing trade or a 21-period EMA for a covered call trade -- or you can use a volatility trailing stop, one that automatically adjusts to the average true range (ATR) of your stock over the past n-periods. Then again, you can go dirt-simple and just use a two- to five-bar trailing stop of the daily lows as your trailing stop. These three types of trailing stops should work for most kinds of swing and trend-following trades. |

|
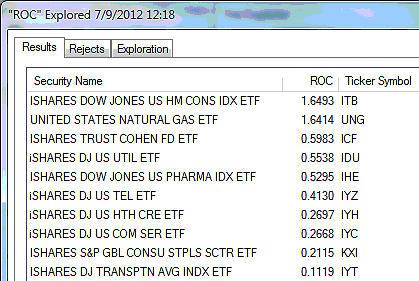
| FIGURE 2: RELATIVE STRENGTH ETFS. The top 10 ranked 13-week relative strength ETFs versus the .OEX as of the close of trading on July 6, 2012. |
| Graphic provided by: MetaStock. |
| Graphic provided by: MetaStock Explorer. |
| |
| In addition to the home builders ETF, the utilities (IDU), natural gas (UNG), real estate (ICF), and pharma (IHE) ETFs are leading the broad markets in terms of 13-week relative strength (Figure 2), so see if you can use the method described here to cull for attractive stocks from each of these diverse market groups. You may be surprised at what you find! |
| The poorest performing groups over the past 13 weeks include oil services (IEZ), oil exploration (IEO), silver (SLV), nuclear energy (NLR), clean energy (ICLN), crude oil (USO), semiconductors (SMH), broker-dealers (IAI), and networking (IGN). It takes a while, but eventually, things do turn around. That wisdom even applies to the sector rotations in the financial markets, too -- little wonder. |
Donald W. Pendergast is a financial markets consultant who offers specialized services to stock brokers and high net worth individuals who seek a better bottom line for their portfolios.
| Title: | Writer, market consultant |
| Company: | Linear Trading Systems LLC |
| Jacksonville, FL 32217 | |
| Phone # for sales: | 904-239-9564 |
| E-mail address: | lineartradingsys@gmail.com |
Traders' Resource Links | |
| Linear Trading Systems LLC has not added any product or service information to TRADERS' RESOURCE. | |
Click here for more information about our publications!
PRINT THIS ARTICLE

|

Request Information From Our Sponsors
- StockCharts.com, Inc.
- Candle Patterns
- Candlestick Charting Explained
- Intermarket Technical Analysis
- John Murphy on Chart Analysis
- John Murphy's Chart Pattern Recognition
- John Murphy's Market Message
- MurphyExplainsMarketAnalysis-Intermarket Analysis
- MurphyExplainsMarketAnalysis-Visual Analysis
- StockCharts.com
- Technical Analysis of the Financial Markets
- The Visual Investor
- VectorVest, Inc.
- Executive Premier Workshop
- One-Day Options Course
- OptionsPro
- Retirement Income Workshop
- Sure-Fire Trading Systems (VectorVest, Inc.)
- Trading as a Business Workshop
- VectorVest 7 EOD
- VectorVest 7 RealTime/IntraDay
- VectorVest AutoTester
- VectorVest Educational Services
- VectorVest OnLine
- VectorVest Options Analyzer
- VectorVest ProGraphics v6.0
- VectorVest ProTrader 7
- VectorVest RealTime Derby Tool
- VectorVest Simulator
- VectorVest Variator
- VectorVest Watchdog
