HOT TOPICS LIST
- MACD
- Fibonacci
- RSI
- Gann
- ADXR
- Stochastics
- Volume
- Triangles
- Futures
- Cycles
- Volatility
- ZIGZAG
- MESA
- Retracement
- Aroon
INDICATORS LIST
LIST OF TOPICS
PRINT THIS ARTICLE
by Chaitali Mohile
A bullish reversal signal at the bottom of the declining rally has not been able to strengthen the potential bullish rally of Baxter International.
Position: N/A
Chaitali Mohile
Active trader in the Indian stock markets since 2003 and a full-time writer. Trading is largely based upon technical analysis.
PRINT THIS ARTICLE
TECHNICAL ANALYSIS
Baxter Int'l Is Undergoing An Unstable Rally
07/10/12 09:14:49 AMby Chaitali Mohile
A bullish reversal signal at the bottom of the declining rally has not been able to strengthen the potential bullish rally of Baxter International.
Position: N/A
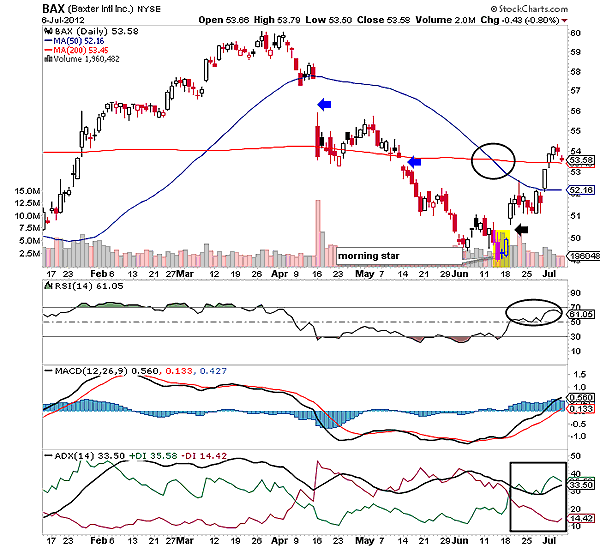
| Baxter International (BAX) was flooded with huge bearish pressure as the price approached a high at 60 levels. The bears forced the stock to plunge rapidly, breaching the initial support of the 50-day moving average (MA). A huge gap down broke the short-term moving average support. Later, price respected the robust support of the 200-day moving average (MA). However, the support was established for a short period. Once again, a gap down violated the moving average support (Figure 1). Though the gap was very small, the descending rally hurriedly slipped down. |
| The downward price action reversed the previous developed uptrend in Figure 1. The average directional index (ADX) (14) continued to glide between the 30 and 40 regions, but the bearish rally accelerated the selling pressure, reversing the developed bullish trend to a fresh downtrend. The relative strength index (RSI) (14) that was moving with the support of 70 levels in an overbought region began its bearish journey. Soon, the oscillator hit oversold levels at around 30, terminating the current declining rally. The moving average convergence/divergence (MACD) (12,26,9) was tangled to the trigger line in negative territory, suggesting huge volatility in the rally. On these notes, BAX established support near 49/50 levels, showing the possibility of a relief rally. |

|
| FIGURE 1: BAX, DAILY |
| Graphic provided by: StockCharts.com. |
| |
| The stock formed a morning star bullish reversal candlestick pattern at the bottom the rally. Accordingly, a fresh pullback was initiated on the positive notes of the indicators as well. A new uptrend was born. The MACD (12,26,9) showed a bullish crossover and readiness to surge in positive territory. The RSI (14) also surged from the oversold region. In addition, a small gap up encouraged the buyers waiting on the sidelines. But the party lasted for a very short time span because the rally became unstable when it hit the 200-day MA resistance. BAX has formed a red doji candlestick near the MA support, threatening a new bullish breakout. The RSI (14) is reluctant to move in an overbought zone, and the buying pressure (green line) of the ADX (14) is likely to shrink. In addition, the 50-day MA has retraced below the 200-day MA, signifying a bearish crossover in Figure 1. In such a scenario, it will be difficult for BAX to sustain above the 200-day MA support and continue the bullish rally. |

|
| FIGURE 2: BAX, WEEKLY |
| Graphic provided by: StockCharts.com. |
| |
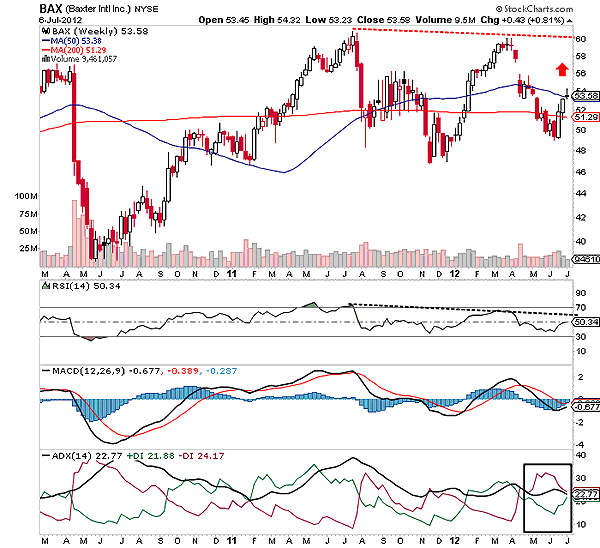
| According to the weekly time frame chart in Figure 2, BAX is moving within a range between 50 and 60. Since mid-2011, the stock has never surged above the 60 levels, nor has it plunged below the 47 levels. Currently, the stock is between the two moving averages. Although the targeted level (upper range) is far from the current price level, it looks as if the bullish move may face some resistance. The RSI (14) is forming a series of lower highs, indicating weakness in the rally. The downtrend (Figure 2) is developing; however, the buying pressure should also be watched carefully. The moving average convergence/divergence (MACD) (12,26,9) is negative, suggesting weak momentum in the stock. |
| Thus, the potential bullish rally is likely to come under threat and the stock will probably not hit the upper range target at 60 levels. The stock is engulfed with huge bearish clouds that have ignored the morning star candlestick pattern. |
Active trader in the Indian stock markets since 2003 and a full-time writer. Trading is largely based upon technical analysis.
| Company: | Independent |
| Address: | C1/3 Parth Indraprasth Towers. Vastrapur |
| Ahmedabad, Guj 380015 | |
| E-mail address: | chaitalimohile@yahoo.co.in |
Traders' Resource Links | |
| Independent has not added any product or service information to TRADERS' RESOURCE. | |
Click here for more information about our publications!
PRINT THIS ARTICLE

|

Request Information From Our Sponsors
- StockCharts.com, Inc.
- Candle Patterns
- Candlestick Charting Explained
- Intermarket Technical Analysis
- John Murphy on Chart Analysis
- John Murphy's Chart Pattern Recognition
- John Murphy's Market Message
- MurphyExplainsMarketAnalysis-Intermarket Analysis
- MurphyExplainsMarketAnalysis-Visual Analysis
- StockCharts.com
- Technical Analysis of the Financial Markets
- The Visual Investor
- VectorVest, Inc.
- Executive Premier Workshop
- One-Day Options Course
- OptionsPro
- Retirement Income Workshop
- Sure-Fire Trading Systems (VectorVest, Inc.)
- Trading as a Business Workshop
- VectorVest 7 EOD
- VectorVest 7 RealTime/IntraDay
- VectorVest AutoTester
- VectorVest Educational Services
- VectorVest OnLine
- VectorVest Options Analyzer
- VectorVest ProGraphics v6.0
- VectorVest ProTrader 7
- VectorVest RealTime Derby Tool
- VectorVest Simulator
- VectorVest Variator
- VectorVest Watchdog
