HOT TOPICS LIST
- MACD
- Fibonacci
- RSI
- Gann
- ADXR
- Stochastics
- Volume
- Triangles
- Futures
- Cycles
- Volatility
- ZIGZAG
- MESA
- Retracement
- Aroon
INDICATORS LIST
LIST OF TOPICS
PRINT THIS ARTICLE
by Koos van der Merwe
Do we invest for the long term using a weekly chart? It sure looks like it.
Position: N/A
Koos van der Merwe
Has been a technical analyst since 1969, and has worked as a futures and options trader with First Financial Futures in Johannesburg, South Africa.
PRINT THIS ARTICLE
DATA
Time Warner Telecom Long Term?
07/09/12 11:33:33 AMby Koos van der Merwe
Do we invest for the long term using a weekly chart? It sure looks like it.
Position: N/A
| Time Warner Telecom (TWTC) is headquartered in Lone Tree, CO. The company provides business class managed voice, Internet, and data network services, specializing in ethernet and transport data networking, Internet access, local and long distance voice, VoIP, and security, to enterprise organizations and communications services companies throughout the US and globally. In other words, the company today is very much a part of the growth in the wireless and internet industry. So do you buy the stock for a Warren Buffett long-term hold? |

|
| FIGURE 1: TWTC, WEEKLY |
| Graphic provided by: OmniTrader. |
| |
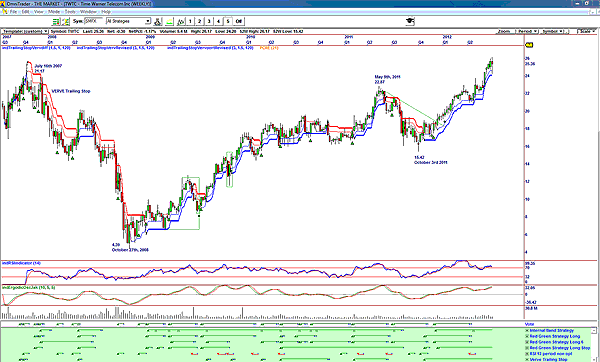
| Figure 1 is a weekly chart of TWTC and shows how the share price fell from a high of 21.17 on July 16, 2007, to a low of $4.39 by October 27, 2008. The share price then rose to a high of $22.87 by May 9, 2011, before falling to $15.42 by October 3, 2011, before rising once again to its present level of $25.36. The indicators on the chart are the Verve trailing stop, the relative strength index (RSI), and the ergodic oscillator. There are also the six strategies I have written summarizing in the vote line, which shows buy and stop-loss signals. So do you follow the stop-loss signals given on the vote line or the signal on the trailing stop? On the weekly chart, you follow neither. On a weekly chart, you follow only the buy signals on the vote line. The sell signals you follow on a daily chart. The weekly chart has not given a buy signal at the moment on the vote line. Interesting and believable, because the RSI and the ergodic oscillator is also showing a sell signal. I would not be a buyer of the stock price at the moment. But let us look at the daily chart. |

|
| FIGURE 2: TWTC, DAILY |
| Graphic provided by: OmniTrader. |
| |
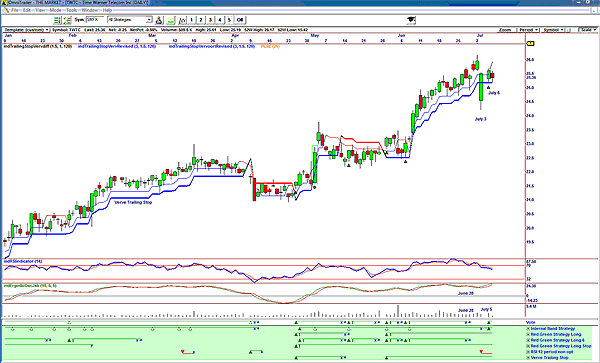
| The daily chart in Figure 2 has the same indicators as the weekly chart. The chart shows how on July 3, the price broke below the Verve trailing stop but closed above it, so a sell signal was not given. Then it retested the trailing stop on July 6 on a down day but did not break below it. The chart does show that a stop-loss signal was given on the vote line on June 28 with a falling RSI. With a weekly chart that has stopped out and not showing a buy signal, you would sell your stock. The vote line shows a buy signal on July 5, but because the weekly chart is not in buy mode, you would not buy. Note also in the strategy list, the RSI 12-period has given a sell signal, so the "Stay away" signal is there. TWTC is definitely a share on my watchlist, and the minute the weekly chart suggests a buy signal, I will look to the daily chart to confirm that buy. |
Has been a technical analyst since 1969, and has worked as a futures and options trader with First Financial Futures in Johannesburg, South Africa.
| Address: | 3256 West 24th Ave |
| Vancouver, BC | |
| Phone # for sales: | 6042634214 |
| E-mail address: | petroosp@gmail.com |
Click here for more information about our publications!
PRINT THIS ARTICLE

Request Information From Our Sponsors
- VectorVest, Inc.
- Executive Premier Workshop
- One-Day Options Course
- OptionsPro
- Retirement Income Workshop
- Sure-Fire Trading Systems (VectorVest, Inc.)
- Trading as a Business Workshop
- VectorVest 7 EOD
- VectorVest 7 RealTime/IntraDay
- VectorVest AutoTester
- VectorVest Educational Services
- VectorVest OnLine
- VectorVest Options Analyzer
- VectorVest ProGraphics v6.0
- VectorVest ProTrader 7
- VectorVest RealTime Derby Tool
- VectorVest Simulator
- VectorVest Variator
- VectorVest Watchdog
- StockCharts.com, Inc.
- Candle Patterns
- Candlestick Charting Explained
- Intermarket Technical Analysis
- John Murphy on Chart Analysis
- John Murphy's Chart Pattern Recognition
- John Murphy's Market Message
- MurphyExplainsMarketAnalysis-Intermarket Analysis
- MurphyExplainsMarketAnalysis-Visual Analysis
- StockCharts.com
- Technical Analysis of the Financial Markets
- The Visual Investor
