

HOT TOPICS LIST
- MACD
- Fibonacci
- RSI
- Gann
- ADXR
- Stochastics
- Volume
- Triangles
- Futures
- Cycles
- Volatility
- ZIGZAG
- MESA
- Retracement
- Aroon
INDICATORS LIST
LIST OF TOPICS
PRINT THIS ARTICLE
by Donald W. Pendergast, Jr.
Powerful, rising cycles appear to have a major role in propelling the .OEX up toward a major cycle high by early October 2012.
Position: N/A
Donald W. Pendergast, Jr.
Donald W. Pendergast is a financial markets consultant who offers specialized services to stock brokers and high net worth individuals who seek a better bottom line for their portfolios.
PRINT THIS ARTICLE
CYCLES
PENDY'S PICKS: July 5, 2012
07/05/12 04:07:57 PMby Donald W. Pendergast, Jr.
Powerful, rising cycles appear to have a major role in propelling the .OEX up toward a major cycle high by early October 2012.
Position: N/A
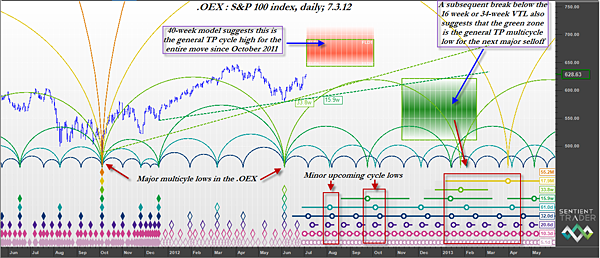
| Previously in PENDY'S PICKS, I presented relative strength (RS) listings for components of the Standard & Poor's 100 index (.OEX) and discussed buy/sell signal action. In this article, I will help get you better acquainted with the price cycles that are currently driving the OEX. But first, let's be clear that cycle analysis, like other forms of technical analysis, is at best an imperfect tool. However, since price cycles tend to recur, and since being able to predict a likely (not absolute or exact) time/price window for a multicycle high or low can be of immense value to a skilled trader, it only makes sense to keep track of the current cycles in a major large-cap index like the .OEX. After all, being able to stay on the right side of such multicycle turning points can make a sizable difference in the trader's bottom line. With that said, let's take a look at the rather busy chart in Figure 1, which is a daily chart of the .OEX overlaid with cycle analysis from Sentient Trader software: |
|
| FIGURE 1: CYCLE ANALYSIS. Proper cycle analysis can help keep traders abreast of the big picture, thus helping them stay on the right side of the markets a greater percentage of the time. This is the nominal 40-week time/price projection set for the S&P 100 index (.OEX). |
| Graphic provided by: Sentient Trader. |
| |
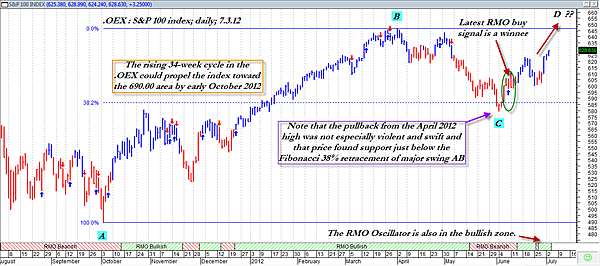
| Note that the early October 2011 swing low in the .OEX was a major, major multicycle low and that the price rise from that low (488.67) until the April 2, 2012, high (646.76) was a move of 32.35%. The subsequent pullback to the low of June 4, 2012, was proportional and orderly as opposed to being sharp and violent, suggesting that this 40% pullback following the October 2011 to April 2012 rally was not a sign of a major trend reversal. That, plus the fact that the nominal (ideal) 33.8-week and 15.9-week cycles are still in a strongly rising mode, leads me to conclude that the red, shaded time/price (TP) zone on the chart is the general area in which to expect the entire move higher from the October 2011 low to finally peak and then roll over in a trend reversal of significant degree. The top price anticipated is 691.19, being achieved no later than October 2, 2012. If that comes to pass and ends up being the ultimate 34-week and/or 16-week cycle high, it would mean a gain of more than 41% in 12 months — a very impressive move for a large-cap stock index. Of course, while no one can predict the exact time/price turning point for that anticipated cycle high, by monitoring the cycles and key support/resistance action on a daily basis, it becomes much easier to narrow down the timing window by a large degree. Once the reversal occurs, however, we will have the same cycles moving lower, and if both of the key valid trendlines (VTLs) are violated as the .OEX turns lower, then the large green TP zone becomes more of a magnet for any further selloffs to eventually bottom within. The window is very large, as these are high-degree cycles at work, but the analysis suggests that the .OEX should bottom out at no lower than 511.12 and at no later a date than February 17, 2013. Again, this is a general, anticipated outlook, but at least this provides some advance warning of what has a reasonably high probability of occurring over the next four to seven months. Let's look at a second chart. In Figure 2 you see the .OEX's complete rise from October 4, 2011. Note that the RMO (Rahul Mohindar) swing buy signal in June 2012 has proved to be profitable and that the index has recovered a good part of the losses incurred since making a swing high on May 1, 2012. |
|
| FIGURE 2: RISING 34-WEEK CYCLE. Although the .OEX did pull back by 40% of major swing AB's rise, the decline wasn't all that swift or violent; no RMO swing sells were generated during May's selloff. The latest RMO swing buy signal has proven to be a big winner. |
| Graphic provided by: MetaStock. |
| Graphic provided by: RMO indicators from MetaStock v.11. |
| |
| Again, remember that it is the dominant price cycles that set the directional pace for nearly every type of financial market; learning to get on and stay on the right side of such powerful cycles can help you make more money on your trades and can also help keep you out of many low-probability trading setups. While there may very well be a near-term pullback in the .OEX if the 643.00 area is reached soon (as the 32- and 61-day cycles turn lower), the higher-degree cycles still appear to have the upper hand, determined to exceed the May 1, 2012, highs between now and October 2012. Trade wisely and stay tuned for more developments. |
Donald W. Pendergast is a financial markets consultant who offers specialized services to stock brokers and high net worth individuals who seek a better bottom line for their portfolios.
| Title: | Writer, market consultant |
| Company: | Linear Trading Systems LLC |
| Jacksonville, FL 32217 | |
| Phone # for sales: | 904-239-9564 |
| E-mail address: | lineartradingsys@gmail.com |
Traders' Resource Links | |
| Linear Trading Systems LLC has not added any product or service information to TRADERS' RESOURCE. | |
Click here for more information about our publications!
Comments

Request Information From Our Sponsors
- StockCharts.com, Inc.
- Candle Patterns
- Candlestick Charting Explained
- Intermarket Technical Analysis
- John Murphy on Chart Analysis
- John Murphy's Chart Pattern Recognition
- John Murphy's Market Message
- MurphyExplainsMarketAnalysis-Intermarket Analysis
- MurphyExplainsMarketAnalysis-Visual Analysis
- StockCharts.com
- Technical Analysis of the Financial Markets
- The Visual Investor
- VectorVest, Inc.
- Executive Premier Workshop
- One-Day Options Course
- OptionsPro
- Retirement Income Workshop
- Sure-Fire Trading Systems (VectorVest, Inc.)
- Trading as a Business Workshop
- VectorVest 7 EOD
- VectorVest 7 RealTime/IntraDay
- VectorVest AutoTester
- VectorVest Educational Services
- VectorVest OnLine
- VectorVest Options Analyzer
- VectorVest ProGraphics v6.0
- VectorVest ProTrader 7
- VectorVest RealTime Derby Tool
- VectorVest Simulator
- VectorVest Variator
- VectorVest Watchdog