HOT TOPICS LIST
- MACD
- Fibonacci
- RSI
- Gann
- ADXR
- Stochastics
- Volume
- Triangles
- Futures
- Cycles
- Volatility
- ZIGZAG
- MESA
- Retracement
- Aroon
INDICATORS LIST
LIST OF TOPICS
PRINT THIS ARTICLE
by Koos van der Merwe
Analyzing a chart using Elliott waves is not always easy.
Position: Accumulate
Koos van der Merwe
Has been a technical analyst since 1969, and has worked as a futures and options trader with First Financial Futures in Johannesburg, South Africa.
PRINT THIS ARTICLE
ELLIOTT WAVE
Three Alternative Elliott Wave Counts For The S&P 500 Index
07/06/12 10:39:03 AMby Koos van der Merwe
Analyzing a chart using Elliott waves is not always easy.
Position: Accumulate
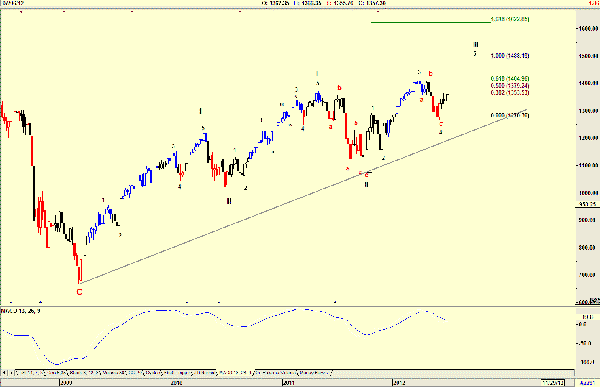
| The first rule in Elliott wave analysis is, "the chart must look correct." In other words, don't look for a complicated Elliott wave count; look for the simplest count there is. When I read newsletters by other Elliott wave analysts calling for a further downside to this market, with an ABC-ABC-ABC correction downward, no matter how hard I try, I simply cannot see it. Either I am blind (which at my age is a very real possibility!), or we are not looking at the same chart. In the early 1980s, Robert Prechter, coauthor of Elliott Wave Principle, was my tutor. Whenever I queried his counts, he would scribble his reply on a chart and mail it to me. (Remember, in those days, there was no Internet.) One particular answer he gave to a question of mine has always stuck in my head: "The Elliott wave theory is simply a signpost in the wilderness," he wrote, "and it can change direction at the next signpost." Another lesson he taught me is underscored in the count shown in Figure 1: |

|
| FIGURE 1: One possible Elliott wave count. |
| Graphic provided by: AdvancedGET. |
| |
| Figure 1 is a weekly chart of the S&P 500 index with a count that suggests the index is rising into a wave 5 of a Wave III of a WAVE III, with a target of 1488.19. The chart certainly "looks correct," and with the MACD indicator turning into a possible buy in the week ahead, the trader can reasonably accept the account as true. However, there is a second count that is possible, which I show in Figure 2: |

|
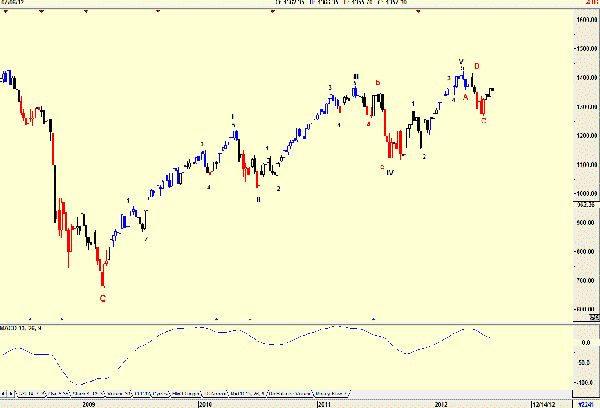
| FIGURE 2: An Elliott wave count where Wave 3 is shorter than Wave 1. |
| Graphic provided by: AdvancedGET. |
| |
| Figure 2 helps demonstrate the second important lesson Robert Prechter taught me. "Can a Wave 3 be smaller than a Wave 1?" I once asked him. "Yes," he replied, "but then Wave 5 will be smaller than Wave 3." The chart in Figure 2 shows this quite clearly. WAVE III is less than WAVE I, and therefore WAVE V must be less than WAVE III, which it is. This chart is also a great deal simpler than the chart in Figure 1, another plus in its favor. The only part of this count that does cause me some worry, however, is the five-wave count in WAVE V. The ABC correction could also be in doubt. Thus, I show an alternative count in Figure 3: |

|
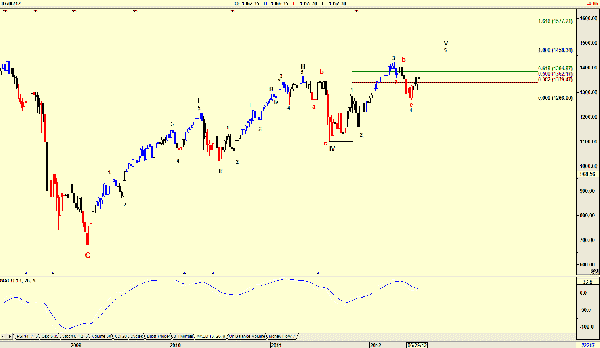
| FIGURE 3: An alternative count for Wave V. |
| Graphic provided by: AdvancedGET. |
| |
| With my alternative count in Figure 3, I am suggesting there is still a wave 5 of WAVE V to come, with a possible target of 1458.34. This target is identical to the target in Figure 1, even though the major counts are different. WAVE V will still be less than WAVE III, so the count still meets Prechter's rule of a shorter WAVE V if WAVE III is less than WAVE 1. One error that is obvious, however, is that the low of Wave 4 is less than the high of Wave 1, and strictly speaking, that is a no-no; remember, "the chart must look correct." Whichever count is correct, the charts are telling us that we can expect a rise for the future, with a small correction in the cards once WAVE V (as suggested by Figures 1 and 3) or a Wave 1 of a new bull trend (suggested in Figure 2) is complete. |
Has been a technical analyst since 1969, and has worked as a futures and options trader with First Financial Futures in Johannesburg, South Africa.
| Address: | 3256 West 24th Ave |
| Vancouver, BC | |
| Phone # for sales: | 6042634214 |
| E-mail address: | petroosp@gmail.com |
Click here for more information about our publications!
Comments
Date: 07/09/12Rank: 1Comment: Can anybody read these small images or is just my eyes? You should upgrade this page a long time before in order to be able to zoom the images.....
Date: 07/15/12Rank: 5Comment:

Request Information From Our Sponsors
- StockCharts.com, Inc.
- Candle Patterns
- Candlestick Charting Explained
- Intermarket Technical Analysis
- John Murphy on Chart Analysis
- John Murphy's Chart Pattern Recognition
- John Murphy's Market Message
- MurphyExplainsMarketAnalysis-Intermarket Analysis
- MurphyExplainsMarketAnalysis-Visual Analysis
- StockCharts.com
- Technical Analysis of the Financial Markets
- The Visual Investor
- VectorVest, Inc.
- Executive Premier Workshop
- One-Day Options Course
- OptionsPro
- Retirement Income Workshop
- Sure-Fire Trading Systems (VectorVest, Inc.)
- Trading as a Business Workshop
- VectorVest 7 EOD
- VectorVest 7 RealTime/IntraDay
- VectorVest AutoTester
- VectorVest Educational Services
- VectorVest OnLine
- VectorVest Options Analyzer
- VectorVest ProGraphics v6.0
- VectorVest ProTrader 7
- VectorVest RealTime Derby Tool
- VectorVest Simulator
- VectorVest Variator
- VectorVest Watchdog
