

HOT TOPICS LIST
- MACD
- Fibonacci
- RSI
- Gann
- ADXR
- Stochastics
- Volume
- Triangles
- Futures
- Cycles
- Volatility
- ZIGZAG
- MESA
- Retracement
- Aroon
INDICATORS LIST
LIST OF TOPICS
PRINT THIS ARTICLE
by Donald W. Pendergast, Jr.
With a major pennant formation well under way on the daily chart of gold, can price cycle analysis provide some guidance as to which way price will break?
Position: N/A
Donald W. Pendergast, Jr.
Donald W. Pendergast is a financial markets consultant who offers specialized services to stock brokers and high net worth individuals who seek a better bottom line for their portfolios.
PRINT THIS ARTICLE
CYCLES
GLD: Which Way for Pennant Break?
07/05/12 04:23:52 PMby Donald W. Pendergast, Jr.
With a major pennant formation well under way on the daily chart of gold, can price cycle analysis provide some guidance as to which way price will break?
Position: N/A
| Pennant patterns are not necessarily easy to trade if you are using them as a standalone buy/sell indicator (as in buy on a break and close above the top channel line, or vice-versa for a break and close below the bottom channel line). But if you can manage to filter the patterns through the lens of price cycle analysis, you may find that a more usable form of technical analysis is the result. Here's a look at a major pennant formation on the daily chart of GLD, along with some tips on how to determine which cycles you should be paying attention to. |
|
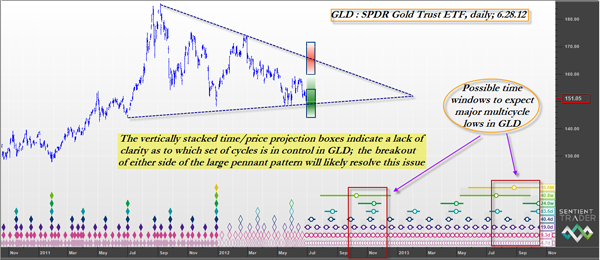
| FIGURE 1: PENNANT FORMATION. With the failed rally out of the May 29, 2012, swing low now looking as if the bears are in control, look for a break below the lower pennant channel line to launch a possible slide to a major multicycle low in the fall of 2012 and the summer/fall of 2013. |
| Graphic provided by: Sentient Trader. |
| |
| At the moment, GLD is running close to the bottom of the daily chart's lower pennant channel, a support that has its roots in the July 2011 swing low at 143.97. Being a year old now, this lower boundary has acted as a basic price support as major multicycle lows were achieved on December 29, 2011, and May 30, 2012. The bullish rally from that late May swing low was rather weak, and in fact has brought GLD back close to where the rally started, setting up a possible near-term retest of the bottom of the pattern. |
| The chart in Figure 1, created by Sentient Trader cycle analysis software, suggests that a kind of tug of war is going on, with the dominant cyclical forces being hard to specifically identify at this point. The fact that the red cycle high time/price projection box is stacked right above the green cycle low time/price projection box indicates that caution is advised for traders until one or more cycles begins to take control of GLD. If you look directly below the May 29, 2012, swing low, you may notice that the stack of diamonds (indicating that as many as six separate cycles bottomed at that time) is shorter than the previous stack (eight cycles bottoming at once). Note also that the next anticipated multicycle low is due sometime between September and December 2012 (leftmost red vertical box at bottom of chart). The current failed upswing from the May 29, 2012, low may be hinting that GLD's next major move is likely to be down and out of the pennant pattern, as GLD moves lower in search of major support, with perhaps as many as seven price cycles attempting to bottom simultaneously in the fall of 2012. Note that an even larger multicycle low (eight cycles) is anticipated to form sometime between July and October of 2013; if the commodities boom of 1999/2001 through 2011 is truly a done deal, then it would not be surprising to see gold at significantly lower prices over the next 12 to 15 months. |
|
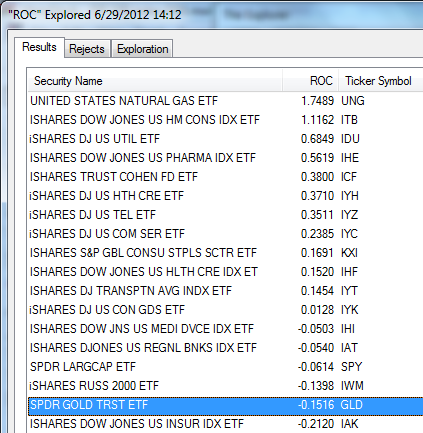
| FIGURE 2: RELATIVE STRENGTH. GLD has a negative 13-week relative strength versus the S&P 100 index (.OEX). It is, however, outperforming the S&P 500 (SPY) and Russell 2000 (IWM) indexes. |
| Graphic provided by: MetaStock. |
| Graphic provided by: MetaStock Explorer. |
| |
| Why is this type of cycle analysis useful? This is probably not the best time to be trading on fundamentals alone, especially if you are a true gold bug; the global economy has so many distorted linkages today that many times a market like gold may behave in ways that would not have been believed possible in the last gold bull market of the 1970s. For example, if there is a direct link between inflation and gold prices, why isn't gold trading at at least two or even three times higher than it is today? In the '70s and early '80s, consumer price inflation was a major headache for Americans, but even with 9 to 13% inflation rates (it was 13.4% in 1979, believe it or not), investors were able to get safe returns in Treasury bills paying 10-14% (yes, they really did pay that much), and bank CDs also paid around 10%. Gold and silver also offered patient investors returns far greater than that. In current times, the government has created astronomical amounts of money that is filtering its way into the financial markets, but even these bubbles have begun to burst. Food and medical care continue to rise at late-1970s double-digit inflation rates; unemployment is still officially more than 8%; and real estate struggles to find a price floor after years of declines. In short, don't assume that gold has to go up because you've been told it's a safe haven or store of value. The US is in a structural depression (a very different economic climate from the '70s and early '80s) that could take a generation or more to climb fully out of, and the economic landscape could not be more of a mess -- until next week, of course! My point is this: Learn to think for yourself, and if your technical/fundamental/seasonal analysis and mechanical systems paint a convincing sell signal in gold, oil, grains, or stock indexes, by all means put more confidence in your own well-thought-out market studies than in the gold bugs, investment newsletters, and commodity gurus, some of whom may be fighting the current war for economic survival with the weapons and tactics of a previous generation. |
Donald W. Pendergast is a financial markets consultant who offers specialized services to stock brokers and high net worth individuals who seek a better bottom line for their portfolios.
| Title: | Writer, market consultant |
| Company: | Linear Trading Systems LLC |
| Jacksonville, FL 32217 | |
| Phone # for sales: | 904-239-9564 |
| E-mail address: | lineartradingsys@gmail.com |
Traders' Resource Links | |
| Linear Trading Systems LLC has not added any product or service information to TRADERS' RESOURCE. | |
Click here for more information about our publications!
Comments

Request Information From Our Sponsors
- StockCharts.com, Inc.
- Candle Patterns
- Candlestick Charting Explained
- Intermarket Technical Analysis
- John Murphy on Chart Analysis
- John Murphy's Chart Pattern Recognition
- John Murphy's Market Message
- MurphyExplainsMarketAnalysis-Intermarket Analysis
- MurphyExplainsMarketAnalysis-Visual Analysis
- StockCharts.com
- Technical Analysis of the Financial Markets
- The Visual Investor
- VectorVest, Inc.
- Executive Premier Workshop
- One-Day Options Course
- OptionsPro
- Retirement Income Workshop
- Sure-Fire Trading Systems (VectorVest, Inc.)
- Trading as a Business Workshop
- VectorVest 7 EOD
- VectorVest 7 RealTime/IntraDay
- VectorVest AutoTester
- VectorVest Educational Services
- VectorVest OnLine
- VectorVest Options Analyzer
- VectorVest ProGraphics v6.0
- VectorVest ProTrader 7
- VectorVest RealTime Derby Tool
- VectorVest Simulator
- VectorVest Variator
- VectorVest Watchdog