

HOT TOPICS LIST
- MACD
- Fibonacci
- RSI
- Gann
- ADXR
- Stochastics
- Volume
- Triangles
- Futures
- Cycles
- Volatility
- ZIGZAG
- MESA
- Retracement
- Aroon
INDICATORS LIST
LIST OF TOPICS
PRINT THIS ARTICLE
by Gary Grosschadl
The banking sector's ascending triangle is being challenged probably because of credit quality concerns and of course the bearish pressure on the main indices.
Position: N/A
Gary Grosschadl
Independent Canadian equities trader and technical analyst based in Peterborough
Ontario, Canada.
PRINT THIS ARTICLE
CHART ANALYSIS
Bank Index Being Tested
06/21/02 11:10:45 AMby Gary Grosschadl
The banking sector's ascending triangle is being challenged probably because of credit quality concerns and of course the bearish pressure on the main indices.
Position: N/A
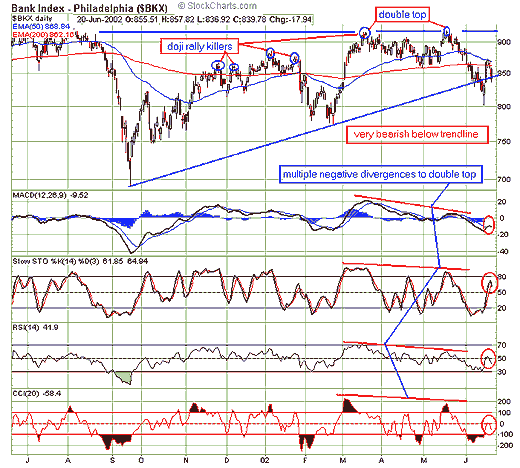
| The bank index has been in a long term 5-year ascending triangle and this is considered a bullish formation. However a sustained move below the lower trendline would negate the bullish outlook. Last week when this index touched 800 it bounced off this 5-year lower trendline. |
| Looking at the one-year chart we can still see this ascending triangle. In this time frame the lower trendline lies higher at about 845. This line has been violated twice now in a short span and this could well be a warning of more downside ahead. |
|
| Graphic provided by: stockcharts.com. |
| |
| Note on the chart that a previous topping formation -- a double top warned of trouble ahead. Also note that there were multiple negative divergences giving extra credence to the double top warning. Another observation is the number of what I have previously named "doji rally killers." A doji or near doji candlestick after a sizeable rally is a significant warning of a short term top. |
| This trendline challenge seems more dangerous than the previous ones because the latter's touches were followed by noteable bullish rallies. This time there is an abrupt reversal (in sync with main indices). The chart indicators also show this well. I find reversals of RSI at 50 and CCI at 0, particularily bearish ones. |
| Should the bank index stay under the lower trendline, then the outlook ahead is bearish not only for banks but also the health of the overall market. This becomes more ominous below the previously mentioned 5-year trendline at 800. Should we have a bullish reversal soon with some legs, then we could look for a nice move back to the top trendline. However danger may still lurk there as traders would be watching for the possibility of a triple top formation (perhaps even another "doji rally killer"). The future will soon tell us if this long term ascending triangle is indeed a bullish development. The outcome either way will be telling as with most triangle patterns. |
Independent Canadian equities trader and technical analyst based in Peterborough
Ontario, Canada.
| Website: | www.whatsonsale.ca/financial.html |
| E-mail address: | gwg7@sympatico.ca |
Click here for more information about our publications!
Comments
Date:�06/25/02Rank:�5Comment:�
Date:�07/02/02Rank:�5Comment:�

Request Information From Our Sponsors
- StockCharts.com, Inc.
- Candle Patterns
- Candlestick Charting Explained
- Intermarket Technical Analysis
- John Murphy on Chart Analysis
- John Murphy's Chart Pattern Recognition
- John Murphy's Market Message
- MurphyExplainsMarketAnalysis-Intermarket Analysis
- MurphyExplainsMarketAnalysis-Visual Analysis
- StockCharts.com
- Technical Analysis of the Financial Markets
- The Visual Investor
- VectorVest, Inc.
- Executive Premier Workshop
- One-Day Options Course
- OptionsPro
- Retirement Income Workshop
- Sure-Fire Trading Systems (VectorVest, Inc.)
- Trading as a Business Workshop
- VectorVest 7 EOD
- VectorVest 7 RealTime/IntraDay
- VectorVest AutoTester
- VectorVest Educational Services
- VectorVest OnLine
- VectorVest Options Analyzer
- VectorVest ProGraphics v6.0
- VectorVest ProTrader 7
- VectorVest RealTime Derby Tool
- VectorVest Simulator
- VectorVest Variator
- VectorVest Watchdog