HOT TOPICS LIST
- MACD
- Fibonacci
- RSI
- Gann
- ADXR
- Stochastics
- Volume
- Triangles
- Futures
- Cycles
- Volatility
- ZIGZAG
- MESA
- Retracement
- Aroon
INDICATORS LIST
LIST OF TOPICS
PRINT THIS ARTICLE
by Donald W. Pendergast, Jr.
The .OEX successfully tested an important intraday support level on Thursday. Will the index soon find its way to higher levels?
Position: N/A
Donald W. Pendergast, Jr.
Donald W. Pendergast is a financial markets consultant who offers specialized services to stock brokers and high net worth individuals who seek a better bottom line for their portfolios.
PRINT THIS ARTICLE
TECHNICAL ANALYSIS
PENDY'S PICKS: June 29, 2012
06/29/12 09:09:10 AMby Donald W. Pendergast, Jr.
The .OEX successfully tested an important intraday support level on Thursday. Will the index soon find its way to higher levels?
Position: N/A
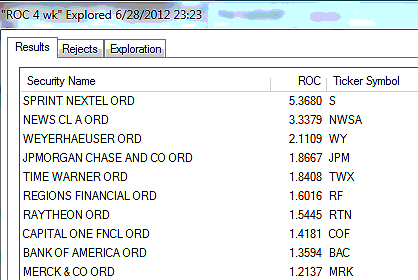
| The Standard & Poor's 100 (.OEX) staged a dramatic intraday support test on Thursday, June 28; the index opened at $610.80 and then quickly descended down to $603.03 before surging higher to close at $609.05. This quick and decisive repudiation of a continued intraday selloff is convincing evidence that the .OEX may already be in a minor bullish swing move, with the line of least resistance now being in favor of further gains over the next three to six trading sessions. If Thursday's high of $611.91 is exceeded in the next few sessions, the bulls will once again have the upper hand in this all-important large-cap index. Figure 1 is a look at the strongest four-week relative strength (RS) performers in the .OEX. Sprint Nextel (S) is still ranked right at the top of the list; NewsCorp. (NWSA) continues to rank high in the list, as does Weyerhaeuser (WY) and Regions Financial (RF). Bank stocks still make up almost half of the top 10 list in terms of RS; WY is interesting, as it is a major supplier of home construction materials. Might there be an emerging synergy between the nascent recovery in new home construction and banking stocks? Might be something to keep an eye on going forward. |

|
| FIGURE 1: STRONGEST OEX COMPONENTS. The 10 strongest S&P 100 (.OEX) components over the past month, as of Thursday, June 28, 2012. |
| Graphic provided by: MetaStock. |
| Graphic provided by: MetaStock Explorer. |
| |
| Figure 2 is a look at the weakest four-week relative strength performers in the .OEX. Of these 10 weakest large caps, five are still hailing from the energy sector -- Halliburton (HAL), National Oilwell Varco (NOV), Baker Hughes (BHI), Devon Energy (DVN), and Williams Cos. (WMB) have all been hit hard. At some point it would be reasonable to expect a sizable rebound rally, especially if there is a meaningful amount of short covering in the crude oil futures market. In fact, NOV, BHI, and DVN will all trigger new RMO swing buy signals as soon as their respective Thursday highs are exceeded. Whether this is just a normal technical correction in the midst of an ongoing bear market or more of a trend reversal remains a mystery at this point. Also notable here are Nike (NKE) and Hewlett-Packard (HPQ); look for low-risk intraday shorting opportunities, given their poor RS vs. the .OEX. |

|
| FIGURE 2: WEAKEST OEX COMPONENTS. The 10 weakest S&P 100 (.OEX) components over the past month, as of Thursday, June 28, 2012. |
| Graphic provided by: MetaStock. |
| Graphic provided by: MetaStock Explorer. |
| |
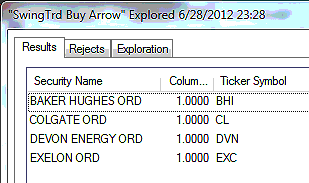
| Figure 3 are the S&P 100 components giving RMO swing buy signals; there were no RMO swing sell signals as of Thursday's close. Of the .OEX components, 4% issued new RMO swing buy signals on Wednesday, confirming a shift toward a bullish bias in large-cap energy issues, especially if all of them are triggered buys, moving above their respective highs on Thursday. Of the four stocks firing buy signals, three are from the energy sector (see comments on BHI and DVN) and one is a consumer staples issue - Colgate (CL). |

|
| FIGURE 3: SWING SELL SIGNALS. The S&P 100 (.OEX) components issued RMO swing sell signals at the close of trading on Thursday, June 28, 2012; 4% of all .OEX components fired buy signals during this session, with no new sell signals issued. |
| Graphic provided by: MetaStock. |
| Graphic provided by: MetaStock Explorer. |
| |
| Figure 4 shows the single exchange traded fund (ETF) from major industry groups or sectors that are flashing new RMO swing buy signals; the iShares Natural Resources (IGE) and iShares Cohen and Steers Realty Majors Index (ICF) ETFs will trigger new long entry signals on a rise above their respective Thursday highs. There were no new RMO swing sell signals in any of the ETFs that this report regularly tracks. |

|
| FIGURE 4: SWING BUY SIGNALS. The two ETFs that fired new RMO swing buy signals as of the close of trading on Thursday, June 28, 2012. |
| Graphic provided by: MetaStock. |
| Graphic provided by: MetaStock Explorer. |
| |
| The 16-week and 61-day price cycles in the .OEX appear to be flexing their muscles. Both of these cycles are in up mode, even though the 32-, 17-, and 10-day cycles are moving lower. A possible outcome of this cyclical tug of war is that the smaller three cycles will still bottom in the next few weeks, albeit in the context of a rising market, one driven by the currently bullish 16-week and 61-day cycles. The situation in Europe and in the global commodities market will no doubt play a big part in helping determine the OEX's next significant trend move. |
Donald W. Pendergast is a financial markets consultant who offers specialized services to stock brokers and high net worth individuals who seek a better bottom line for their portfolios.
| Title: | Writer, market consultant |
| Company: | Linear Trading Systems LLC |
| Jacksonville, FL 32217 | |
| Phone # for sales: | 904-239-9564 |
| E-mail address: | lineartradingsys@gmail.com |
Traders' Resource Links | |
| Linear Trading Systems LLC has not added any product or service information to TRADERS' RESOURCE. | |
Click here for more information about our publications!
PRINT THIS ARTICLE

Request Information From Our Sponsors
- StockCharts.com, Inc.
- Candle Patterns
- Candlestick Charting Explained
- Intermarket Technical Analysis
- John Murphy on Chart Analysis
- John Murphy's Chart Pattern Recognition
- John Murphy's Market Message
- MurphyExplainsMarketAnalysis-Intermarket Analysis
- MurphyExplainsMarketAnalysis-Visual Analysis
- StockCharts.com
- Technical Analysis of the Financial Markets
- The Visual Investor
- VectorVest, Inc.
- Executive Premier Workshop
- One-Day Options Course
- OptionsPro
- Retirement Income Workshop
- Sure-Fire Trading Systems (VectorVest, Inc.)
- Trading as a Business Workshop
- VectorVest 7 EOD
- VectorVest 7 RealTime/IntraDay
- VectorVest AutoTester
- VectorVest Educational Services
- VectorVest OnLine
- VectorVest Options Analyzer
- VectorVest ProGraphics v6.0
- VectorVest ProTrader 7
- VectorVest RealTime Derby Tool
- VectorVest Simulator
- VectorVest Variator
- VectorVest Watchdog
