HOT TOPICS LIST
- MACD
- Fibonacci
- RSI
- Gann
- ADXR
- Stochastics
- Volume
- Triangles
- Futures
- Cycles
- Volatility
- ZIGZAG
- MESA
- Retracement
- Aroon
INDICATORS LIST
LIST OF TOPICS
PRINT THIS ARTICLE
by Donald W. Pendergast, Jr.
The .OEX had some more upside on Wednesday, putting some hope in the hearts of the bulls.
Position: N/A
Donald W. Pendergast, Jr.
Donald W. Pendergast is a financial markets consultant who offers specialized services to stock brokers and high net worth individuals who seek a better bottom line for their portfolios.
PRINT THIS ARTICLE
TECHNICAL ANALYSIS
PENDY'S PICKS: June 28, 2012
06/28/12 09:56:14 AMby Donald W. Pendergast, Jr.
The .OEX had some more upside on Wednesday, putting some hope in the hearts of the bulls.
Position: N/A
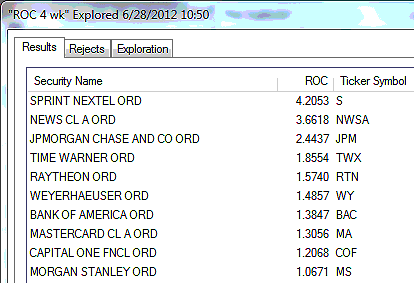
| The .OEX (Standard & Poor's 100) turned slightly higher on Tuesday, closing at $610.80, providing a bit more confidence for the bulls after Wednesday's indecisive price action. Figure 1 is a look at the strongest four-week relative strength performers in the .OEX. Sprint Nextel (S) is ranked right at the top of the list, far outperforming the S&P 100 over the past month; note how using a four-week relative strength ranking provides a different look at the internal rotation of the large-cap stocks, compared to that offered by the longer-term 13-week ranking. This report will focus on the four-week ranking going forward, as this should be better suited to shorter-term (intraday and swing) traders. NewsCorp. (NWSA) and TimeWarner (TWX) are two giant media names that are easily outperforming, and -- surprise! -- look at the relative strength of the major banking outfits -- names such as JPMorganChase (JPM), Bank of America (BAC), and Morgan Stanley (MS) are also beating out the .OEX over the past month. Go figure! |

|
| FIGURE 1: STRONGEST OEX COMPONENTS. Here are the 10 strongest S&P 100 (.OEX) components that have been outperforming the index over the past four weeks, as of Wednesday, June 27, 2012. |
| Graphic provided by: MetaStock. |
| Graphic provided by: MetaStock Explorer. |
| |
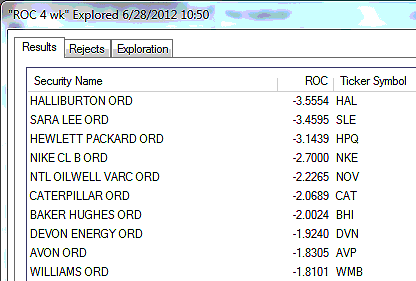
| Figure 2 is a look at the weakest four-week relative strength performers in the .OEX. Of these 10 weakest large caps, five of them are from the energy sector: Halliburton (HAL), National Oilwell Varco (NOV), Baker Hughes (BHI), Devon Energy (DVN), and Williams Cos. (WMB) are all in major bear declines. Just like other hard-hit market sectors, expect these stocks to offer major buying opportunities later this year. For now, each of these stocks look like great intraday shorting candidates, especially with crude oil still near $80 per barrel. Also notable here are Sara Lee (SLE), Avon Products (AVP), and Caterpillar (CAT). CAT has really been hammered lately; this stock has a tendency to embark on major, sustained trend moves -- higher or lower -- and skilled traders love to focus on such high-beta stocks when it's time to make some money. |

|
| FIGURE 2: WEAKEST OEX COMPONENTS. The 10 weakest S&P 100 (.OEX) components that have been underperforming the .OEX over the past month as of Tuesday, June 26, 2012. |
| Graphic provided by: MetaStock. |
| Graphic provided by: MetaStock Explorer. |
| |
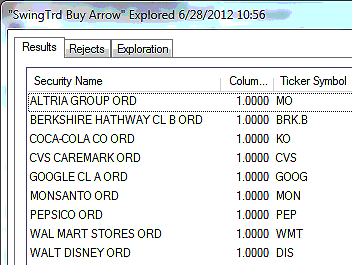
| Figure 3 are the S&P 100 components giving RMO swing buy signals; there was only one RMO swing sell signal (a short RMO swing sell signal in Dow Chemical [DOW]) as of Wednesday's close. A full 9% of the .OEX components issued new RMO swing buy signals on Wednesday, giving us a 9-to-1 ratio between buys and sells, which shows a shift toward a bullish bias in large caps, especially if all of them are triggered buys, moving above their respective highs on Wednesday. Note that virtually all of these stocks are from defensive market sectors like health care, consumer staples, insurance (one of Berkshire's major holdings is Geico Insurance, for example). Wal-Mart Stores (WMT) and Disney (DIS) are also firing new buy signals, as is Google (GOOG). |

|
| FIGURE 3: RMO SWING SELL SIGNALS. The S&P 100 (.OEX) components issuing RMO swing sell signals at the close of trading on Wednesday, June 27, 2012; 9% of all .OEX components fired buy signals during this session, with shares of Dow Chemical (DOW) managing to fire a new sell signal. |
| Graphic provided by: MetaStock. |
| Graphic provided by: MetaStock Explorer. |
| |
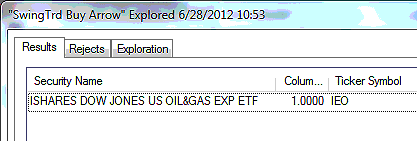
| Figure 4 shows the single exchange traded fund (ETF) from major industry groups or sectors that are flashing new RMO swing buy signals. The iShares Oil Equipment and Services (IEZ) ETF will trigger a new long entry on a rise above Wednesday's high of 44.17. Short-covering rallies like this are not an unusual occurrence after a stock or ETF has already had a substantial decline. If the early June 2012 swing high of $47.46 can be exceeded on this particular reversal, energy bulls will be relieved, but the price cycles are still looking bearish as things stand right now. There were no new RMO swing sell signals in any of the ETFs that this report tracks. |

|
| FIGURE 4: A NEW BUY SIGNAL. The single ETF that fired a new RMO swing buy signal as of the close of trading on Wednesday, June 27, 2012. |
| Graphic provided by: MetaStock. |
| Graphic provided by: MetaStock Explorer. |
| |
| Despite the small rally in the .OEX and other major stock indexes this week, the outlook for more downside remains unchanged, at least until the 32-, 17-, and 10- day price cycles finally make a unified cycle low. The general time frame for this to occur is between July 9 and July 16, 2012; until more info is made available, your best market bias is to remain cautiously bearish and to avoid putting on any new long positions. In addition, if you are a commodities bull, be aware that the times are a-changing. If you are considering adding to any long-term holdings of gold or silver, be aware that the price cycles are not going to be your best friend at this time; the gold market may have its next major multicycle low in October-November 2012. In the meantime, consider trading gold- and silver-related ETFs like GLD, SLV, and GDX playing daily based swings on both the long and short side. A word to the wise should suffice. |
Donald W. Pendergast is a financial markets consultant who offers specialized services to stock brokers and high net worth individuals who seek a better bottom line for their portfolios.
| Title: | Writer, market consultant |
| Company: | Linear Trading Systems LLC |
| Jacksonville, FL 32217 | |
| Phone # for sales: | 904-239-9564 |
| E-mail address: | lineartradingsys@gmail.com |
Traders' Resource Links | |
| Linear Trading Systems LLC has not added any product or service information to TRADERS' RESOURCE. | |
Click here for more information about our publications!
PRINT THIS ARTICLE

Request Information From Our Sponsors
- StockCharts.com, Inc.
- Candle Patterns
- Candlestick Charting Explained
- Intermarket Technical Analysis
- John Murphy on Chart Analysis
- John Murphy's Chart Pattern Recognition
- John Murphy's Market Message
- MurphyExplainsMarketAnalysis-Intermarket Analysis
- MurphyExplainsMarketAnalysis-Visual Analysis
- StockCharts.com
- Technical Analysis of the Financial Markets
- The Visual Investor
- VectorVest, Inc.
- Executive Premier Workshop
- One-Day Options Course
- OptionsPro
- Retirement Income Workshop
- Sure-Fire Trading Systems (VectorVest, Inc.)
- Trading as a Business Workshop
- VectorVest 7 EOD
- VectorVest 7 RealTime/IntraDay
- VectorVest AutoTester
- VectorVest Educational Services
- VectorVest OnLine
- VectorVest Options Analyzer
- VectorVest ProGraphics v6.0
- VectorVest ProTrader 7
- VectorVest RealTime Derby Tool
- VectorVest Simulator
- VectorVest Variator
- VectorVest Watchdog
