HOT TOPICS LIST
- MACD
- Fibonacci
- RSI
- Gann
- ADXR
- Stochastics
- Volume
- Triangles
- Futures
- Cycles
- Volatility
- ZIGZAG
- MESA
- Retracement
- Aroon
INDICATORS LIST
LIST OF TOPICS
PRINT THIS ARTICLE
by Chaitali Mohile
Piper Jaffray Corp. has undergone a bullish breakout. Will the breakout initiate a fresh rally or plunge back into a bearish area?
Position: N/A
Chaitali Mohile
Active trader in the Indian stock markets since 2003 and a full-time writer. Trading is largely based upon technical analysis.
PRINT THIS ARTICLE
BREAKOUTS
PJC Waiting For Breakout Rally
06/28/12 02:45:44 PMby Chaitali Mohile
Piper Jaffray Corp. has undergone a bullish breakout. Will the breakout initiate a fresh rally or plunge back into a bearish area?
Position: N/A
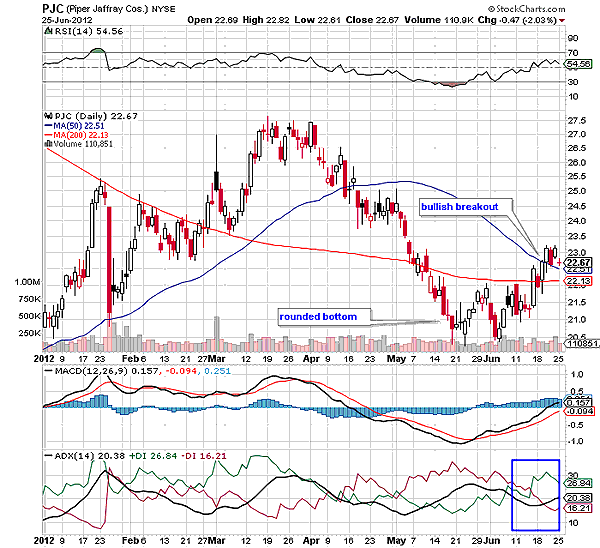
| A declining rally of Piper Jaffray (PJC) formed a bottom immediately below the 200-day moving average (MA) support. The stock turned weaker by converting the moving average support to resistance. But the previous low at 20 extended a strong support to the rally, protecting the stock from an additional damage. A bullish reversal pattern was formed near the support area. An oversold relative strength index (RSI) (14) indicated a weakness in the bearish pressure and a possibility of reversal move. The moving average convergence/divergence (MACD) (12,26,9) turned positive by surging above the trigger line, showing a bullish crossover in negative territory. Thus, the two oscillators signaled the diminishing bearish strength in the stock, resulting in the bottom formation. |

|
| FIGURE 1: PJC, DAILY |
| Graphic provided by: StockCharts.com. |
| |
| A developing downtrend changed its direction, encouraging the price rally to stabilize near the support area. Eventually, the rounded bottom was ready to breach both the moving average resistance. We can see in Figure 1 that a bullish breakout of the pattern developed a fresh uptrend. The average directional index (ADX) (14) climbed the 20 levels with an increased buying pressure (green), developing the bullish trend, and supported the fresh upwards rally. PJC has to sustain above the newly formed moving average supports to strengthen the rally as well as for generating the bullish sentiments. Similarly, the jittery RSI (14) has to establish strong support near the center line (50 levels), and the MACD (12,26,9) has to conquer the positive territory to make the bullish breakout successful. Therefore, the traders have to stay watchful before initiating any long trade. |
| Although the breakout has opened the fresh buying opportunities, PJC in Figure 1 is not healthily bullish, and hence, the long trades are likely to get whipsawed. |

|
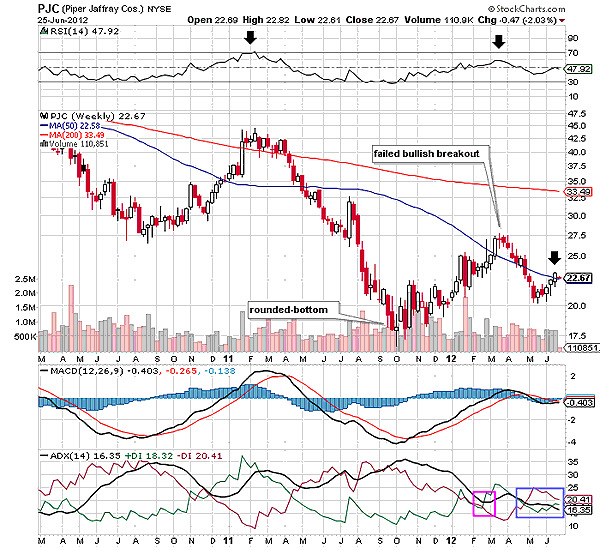
| FIGURE 2: PJC, WEEKLY |
| Graphic provided by: StockCharts.com. |
| |
| PJC has formed various lower highs under the moving average resistance in Figure 2. Neither of the two moving average resistances was violated by the pullback rallies. In 2011, the stock formed the long-term rounded bottom, terminating the robust bearish move that dropped the share value by nearly 50%. But the existing bearish pressure weakened the upward breakout of the pattern, drifting the stock below the 50-day MA resistance. The failed bullish breakout reversed the uptrend (see the small purple block), increasing the selling pressure on the rally. |
| However, PJC made another attempt to break the 50-day MA resistance. But it looks like the oscillators in Figure 2 are reluctant to move in the bullish zone. The RSI (14) is forming the series of lower highs, the MACD (12,26,9) is reluctant to move above the zero line, and ADX (14) is indicating the possibility of bearish consolidation. Thus, PJC is the weak stock and is not ready to initiate the bullish breakout rally. |
Active trader in the Indian stock markets since 2003 and a full-time writer. Trading is largely based upon technical analysis.
| Company: | Independent |
| Address: | C1/3 Parth Indraprasth Towers. Vastrapur |
| Ahmedabad, Guj 380015 | |
| E-mail address: | chaitalimohile@yahoo.co.in |
Traders' Resource Links | |
| Independent has not added any product or service information to TRADERS' RESOURCE. | |
Click here for more information about our publications!
Comments

Request Information From Our Sponsors
- StockCharts.com, Inc.
- Candle Patterns
- Candlestick Charting Explained
- Intermarket Technical Analysis
- John Murphy on Chart Analysis
- John Murphy's Chart Pattern Recognition
- John Murphy's Market Message
- MurphyExplainsMarketAnalysis-Intermarket Analysis
- MurphyExplainsMarketAnalysis-Visual Analysis
- StockCharts.com
- Technical Analysis of the Financial Markets
- The Visual Investor
- VectorVest, Inc.
- Executive Premier Workshop
- One-Day Options Course
- OptionsPro
- Retirement Income Workshop
- Sure-Fire Trading Systems (VectorVest, Inc.)
- Trading as a Business Workshop
- VectorVest 7 EOD
- VectorVest 7 RealTime/IntraDay
- VectorVest AutoTester
- VectorVest Educational Services
- VectorVest OnLine
- VectorVest Options Analyzer
- VectorVest ProGraphics v6.0
- VectorVest ProTrader 7
- VectorVest RealTime Derby Tool
- VectorVest Simulator
- VectorVest Variator
- VectorVest Watchdog
